Influencer Marketing CPM, CPE, CPC and CPA: How to Calculate and Compare Creator Costs
The four cost-efficiency metrics brands use to compare creator campaigns, with formulas, a worked rupee example, conversion rate, the inputs you must define first, and why none of them should be judged alone.
A creator fee on its own tells you very little. ₹50,000 can be cheap or expensive depending on what it bought: how many people saw the content, how many responded, how many clicked and how many bought. Cost-per metrics turn a fee into a number you can compare across creators, campaigns and channels.
Quick answer
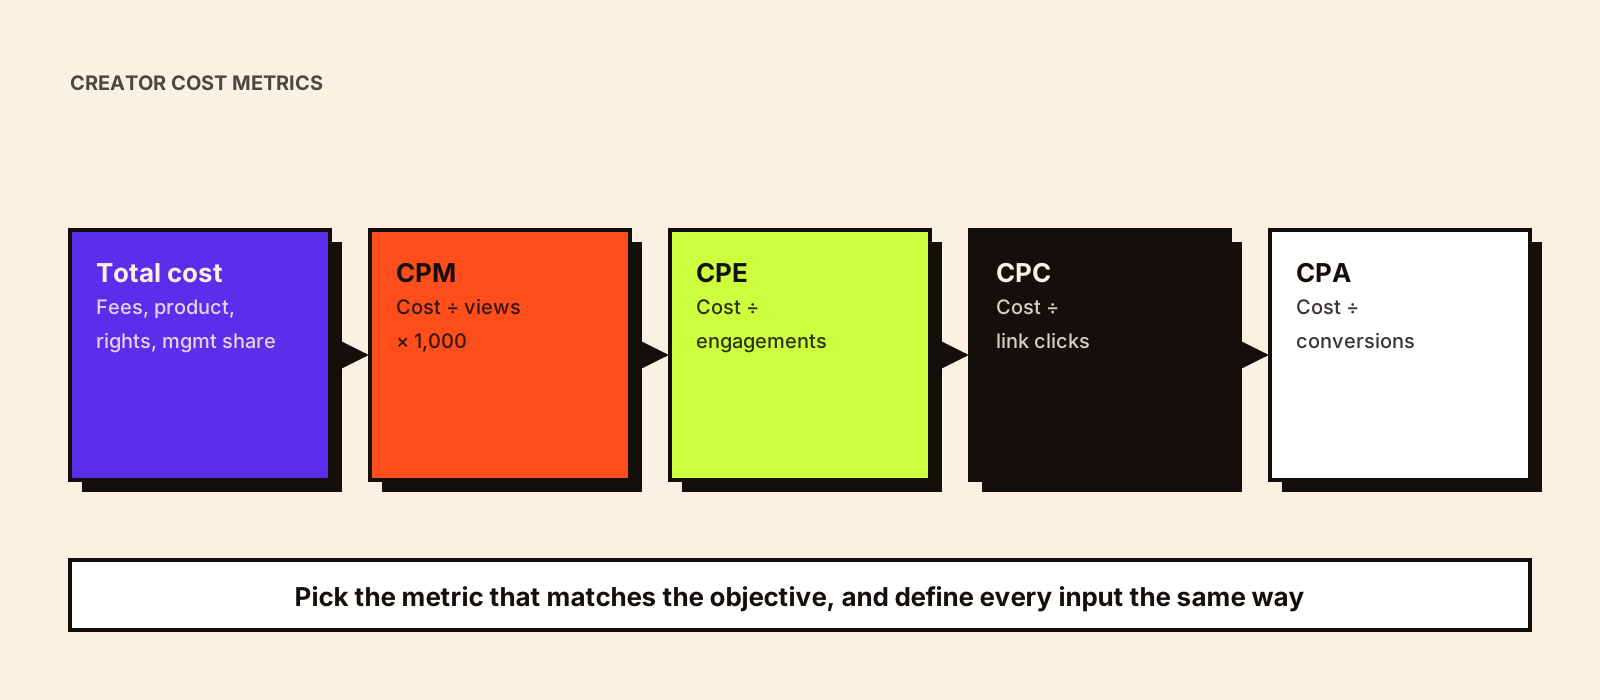
Divide the total campaign cost by the result you care about. CPM = cost ÷ impressions (or views) × 1,000. CPE = cost ÷ engagements. CPC = cost ÷ link clicks. CPA = cost ÷ conversions (orders, sign-ups or installs). Use CPM for awareness, CPE for consideration, CPC for traffic and CPA for sales or leads, and define every input the same way across creators before you compare them.
The formulas at a glance
| Metric | Formula | What it tells you | Best for objective |
|---|---|---|---|
| CPM (cost per mille) | Total cost ÷ impressions or views × 1,000 | Cost of 1,000 exposures | Awareness |
| CPE (cost per engagement) | Total cost ÷ engagements | Cost of each interaction | Consideration, engagement |
| CPC (cost per click) | Total cost ÷ link clicks | Cost of each visit you can track | Traffic |
| CPA (cost per acquisition) | Total cost ÷ conversions | Cost of each order, lead or install | Sales, leads, app installs |
| Conversion rate | Conversions ÷ clicks × 100 | How well visits turn into the action | Sales, leads |
Define the inputs before you calculate
Most bad comparisons come from inconsistent inputs, not wrong arithmetic. Agree these definitions before the campaign starts and use them for every creator:
- Cost: creator fee plus product and shipping, production, usage-rights fees, paid amplification and the share of agency or team time. Using the creator fee alone flatters every metric.
- Impressions or views: the platform's own number from the creator's insights, captured on a fixed day (for example 7 days after posting). Instagram now reports views rather than impressions; see reach vs impressions vs views.
- Engagements: decide which actions count. Saves, shares and genuine comments say more than likes; many brands report CPE on these actions separately.
- Clicks: link clicks recorded by your analytics through each creator's UTM link, not platform 'taps', which can count differently.
- Conversions: delivered orders, qualified leads or completed installs. For cash-on-delivery-heavy categories, count delivered orders, not placed ones.
Reach vs impressions vs views explains the exposure metrics, and influencer engagement rate covers which interactions to count.
A worked example
The numbers below are illustrative, chosen to make the arithmetic easy to follow. They are not benchmarks or typical results.
| Input or metric | Value | Calculation |
|---|---|---|
| Creator fee | ₹60,000 | |
| Product, shipping and share of management | ₹15,000 | |
| Total cost | ₹75,000 | 60,000 + 15,000 |
| Views (7 days) | 1,50,000 | |
| CPM | ₹500 | 75,000 ÷ 1,50,000 × 1,000 |
| Saves, shares and comments | 6,000 | |
| CPE | ₹12.50 | 75,000 ÷ 6,000 |
| Link clicks (UTM) | 1,500 | |
| CPC | ₹50 | 75,000 ÷ 1,500 |
| Delivered orders | 60 | |
| CPA | ₹1,250 | 75,000 ÷ 60 |
| Conversion rate | 4% | 60 ÷ 1,500 × 100 |
Whether ₹1,250 per order is good depends on your margin and customer value, not on an industry average. If the average first order earns ₹800 in gross margin and customers rarely reorder, this creator lost money on direct sales; if half of them reorder within six months, the same CPA may be profitable. That is why CPA belongs next to ROI, covered in how to measure influencer marketing ROI.
Conversion rate: what to measure
- Click-to-conversion rate: conversions ÷ link clicks. Shows whether the creator sent the right people and the landing page kept the promise.
- Code redemption: orders using the creator's code. Catches buyers who never clicked, such as those who searched for the brand later.
- View-to-click rate: link clicks ÷ views. Shows whether the content created enough intent to act.
A low click-to-conversion rate with a healthy view-to-click rate usually points to the landing page or offer, not the creator. The reverse points to the content or the audience fit.
How to compare creators fairly
- Compare on the metric that matches the objective. A creator with a high CPM can still have the best CPA.
- Compare like formats. A 60-second Reel and a 10-minute YouTube integration buy different attention.
- Wait for the same measurement window for every creator, since YouTube videos keep collecting views for months.
- Add the value of content you reuse in ads or on product pages; it would otherwise have cost production budget.
- Don't rank creators on one post. Small samples swing widely; judge on several posts or a test campaign.
Comparing creator costs with paid media
Brands often hold creator CPM against their Meta or YouTube ad CPM. It is a useful sanity check but not a verdict: an organic creator view comes with a recommendation from someone the viewer chose to follow, and the content can be reused as ads afterwards. Compare on the business outcome (CPA, cost per qualified lead) where you can, and use CPM comparisons only for pure reach goals. Influencer performance marketing covers running creator content as ads.
Should you pay creators on CPM or CPA?
These metrics are for evaluation first. Some brands also use them as payment terms, such as a fixed fee plus a bonus per sale, or pure commission. Performance-only deals shift risk to the creator, so experienced creators often decline them or price them higher. How brands should pay influencers compares flat fee, affiliate, CPA and hybrid models.
Common mistakes
- Using only the creator fee as cost
- Mixing reach and views in the same CPM column
- Counting likes as engagement and ignoring saves, shares and comments
- Treating code redemptions as the only conversions, which undercounts results in India where WhatsApp sharing and marketplace purchases leave no code trail
- Calling a CPA 'good' without comparing it to margin and customer lifetime value
How Kudozz handles this: Campaign Reporting & Performance Tracking.