Content Performance Audit for Creators: How to Review Your Last 30 Posts
A step-by-step audit of your last 30 posts with a ready-to-use template: collecting the data, scoring posts against your own medians, spotting patterns and leaving with three clear decisions.
Looking at one post at a time tells you very little. Looking at thirty side by side shows patterns you can't see day to day: which topics carry you, which formats drag, which hooks actually hold. A monthly or quarterly audit is where most useful content decisions come from.
Quick answer
To audit your last 30 posts: export or copy key metrics for each (views, reach, average watch time, saves, shares, comments, follows), tag each post with topic, format, hook type, length and whether it was sponsored, calculate your medians, mark posts above and below median on the metric that matched their goal, look for patterns in the tags, and finish with three decisions: repeat, fix and stop.
The 30-post audit template
# | Date | Platform | Format | Topic/pillar | Series? | Hook type | Length | Sponsored? | Goal (reach/depth/growth/conversion)
| Views | Reach | Non-follower % | Avg watch time / % viewed | Saves | Shares | Comments | Follows gained | Link taps / clicks
| Saves per 1k views | Shares per 1k views | Above/below median on goal metric | Notes
Step by step
- 1. Collect data at a consistent point (e.g. 7 days after posting).
- 2. Tag every post honestly (topic, format, hook, length, sponsored).
- 3. Calculate the median for each metric.
- 4. Mark each post above or below median on its goal metric.
- 5. Sort by tag and count above-median posts per tag.
- 6. Write down three patterns.
- 7. Make three decisions.
Reading the patterns
| Pattern | Possible meaning | Decision |
|---|---|---|
| One pillar above median 70% of the time | Core audience interest | Give it more slots or a series |
| High views, low follows | Broad reach, weak identity | Stronger series and profile |
| Low views, high saves | Valuable but weak hooks | Improve packaging, not topic |
| Sponsored posts well below median | Integration feels like an ad | Change how products are integrated |
| Long posts underperform | Length vs retention issue | Test shorter versions |
Three decisions
REPEAT: ______ (evidence: __ of __ above median)
FIX: ______ (what exactly will change)
STOP: ______ (below median for 2+ audits)

Next audit date: ______
Feed decisions into next month's creator content calendar and track trends in your creator analytics dashboard.
Going deeper: a quarterly 100-post audit
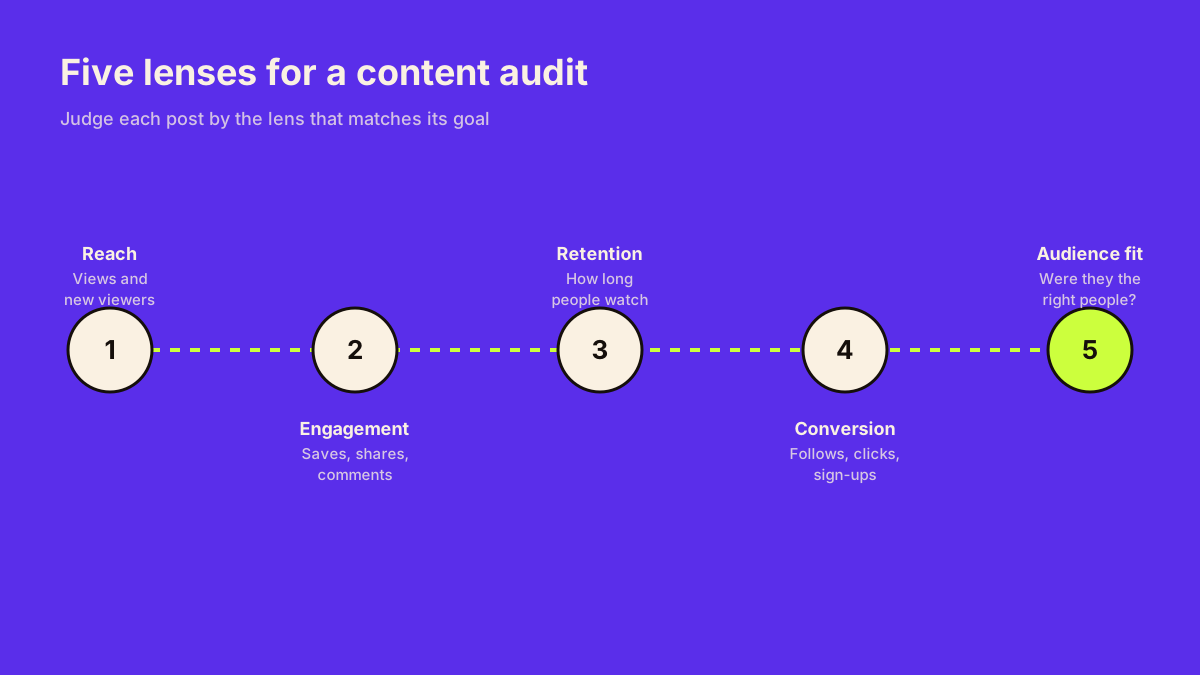
The 30-post audit is a monthly check. Once a quarter, extend it to your last 100 posts (or six months) to see patterns that a month can't show: which pillars grow the audience, which formats convert, and which content attracts the wrong audience.
| Lens | Question | Metric |
|---|---|---|
| Reach | Did it find new people? | Views, non-follower reach |
| Engagement | Did people value it? | Saves and shares per 1,000 views |
| Retention | Did people stay? | Average % watched |
| Conversion | Did it move people? | Follows, clicks, sign-ups per 1,000 views |
| Audience fit | Were they the right people? | Comment quality; audience demographics of top posts |
Finish with decisions for the next quarter's content strategy: which pillars and formats to grow, change or drop. Creator content strategy explains how to update the plan.
Common mistakes
- Collecting data at different times after posting.
- Using averages distorted by one viral post; medians are safer.
- Auditing without tags, so patterns are invisible.
- Ending with observations but no decisions.
For choosing metrics by goal, see creator content analytics; for testing changes, creator A/B testing.
Conclusion
Block ninety minutes a month for this audit. The template gets faster each time, and three clear decisions a month add up to a noticeably better content strategy within a quarter.