Influencer Marketing Reporting for GCC Campaigns: How to Compare Results Across Countries
A reporting framework for creator campaigns across Gulf countries: the metrics to report and how to calculate them, how to compare markets of very different sizes and platform mixes without misleading anyone, organic versus paid, attribution limits and turning results into next actions.
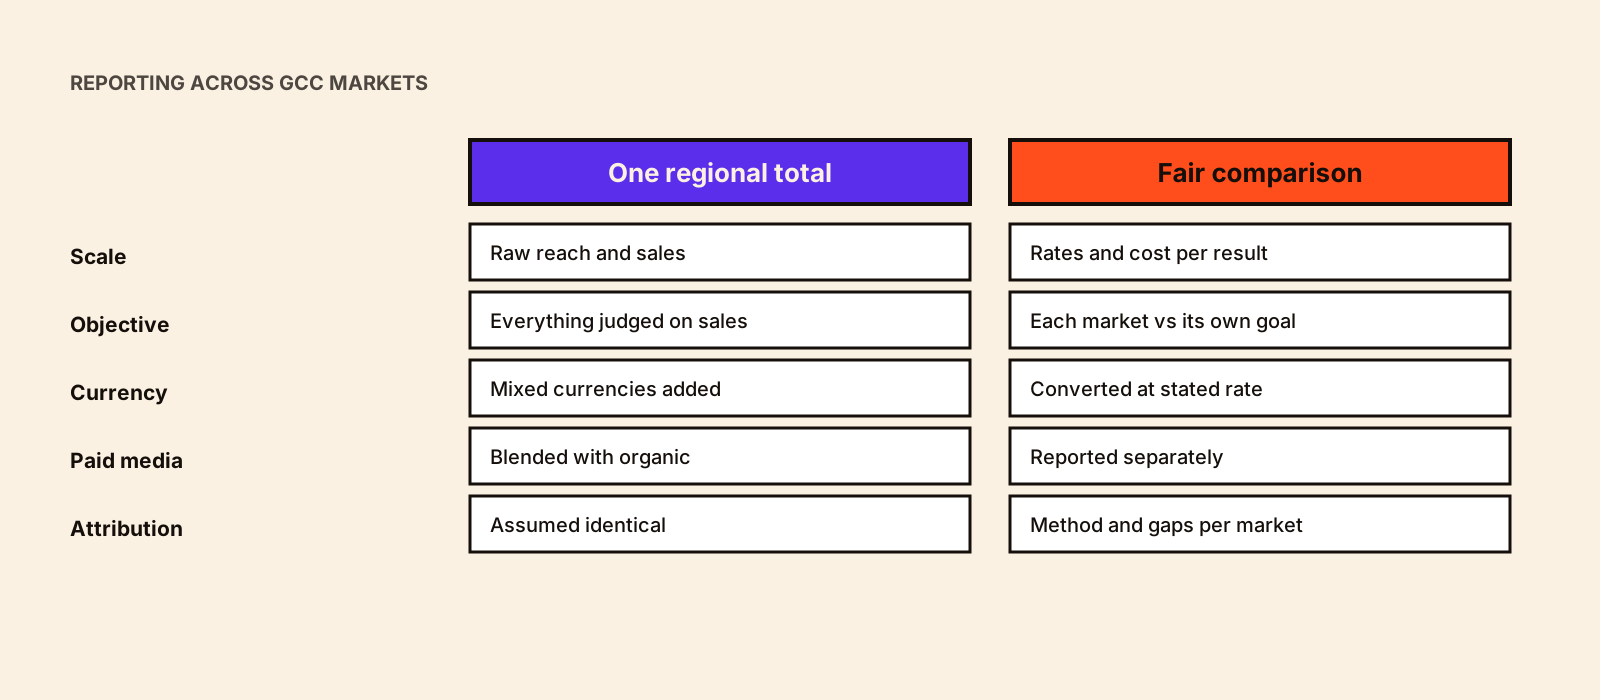
A GCC campaign report that shows one total for reach, one for engagement and one for sales hides almost everything useful. Saudi Arabia has more than ten times Bahrain's population; Snapchat matters more in some markets than others; Arabic and English content reach different people; and attribution works differently where buyers pay on delivery or shop on marketplaces. A good cross-country report compares markets on terms that are fair to each.
Quick answer
To compare GCC influencer results across countries, report each market separately in its own currency, then compare on rates and cost per result rather than raw totals: engagement rate, click-through rate, conversion rate and cost per result in a common reporting currency at a stated exchange rate. Show creator-level and market-level results, separate organic from paid, state the reporting window and attribution method for each market, and flag differences in objective, audience size, platform mix and language. End with learnings and specific next actions per market.
Metrics and how to calculate them
| Metric | Definition | Calculation |
|---|---|---|
| Reach | Unique accounts that saw the content | From creator insights or ad reporting; not additive across creators without deduplication |
| Impressions | Total times content was displayed | Platform-reported |
| Target-market reach | Reach among accounts in the target country | Reach × share of the creator's audience in that country (an estimate) |
| Video views and retention | Plays, and how much was watched | Average watch time ÷ video length; completion rate where available |
| Engagement rate (by reach) | Interactions relative to people reached | (Likes + comments + shares + saves) ÷ reach × 100 |
| Click-through rate | Clicks relative to reach or impressions | Link clicks ÷ reach (or impressions) × 100 |
| Landing-page visits | Sessions from tracked links | From site analytics, by UTM |
| Conversion rate | Visits that became a result | Conversions ÷ landing-page sessions × 100 |
| Qualified leads | Leads meeting agreed criteria | Counted against the definition agreed at kickoff |
| Revenue | Value of attributed orders | Delivered, non-returned orders, in local currency |
| Cost per result | Total cost to achieve each result | Total creator, production and media cost ÷ results |
Single-campaign report structure is covered in how to create an influencer marketing report, and ROI formulas and attribution methods in how to measure influencer marketing ROI.
Comparing markets fairly
| Difference | Why totals mislead | What to report instead |
|---|---|---|
| Market size | Saudi totals will dwarf Bahrain's regardless of performance | Rates and cost per result; share of target audience reached |
| Objective | An awareness test and a sales push aren't comparable on sales | Compare each market against its own objective and target |
| Platform mix | Snapchat-heavy and Instagram-heavy plans produce different engagement patterns | Compare like-for-like platforms; report the mix |
| Language | Arabic and English versions reach different segments | Report by language within each market |
| Audience location | Creators' audiences outside the target market inflate reach | Target-market reach estimates |
| Currency | Costs in different currencies can't be added | Convert at a stated, dated rate for comparison |
| Attribution | Cash on delivery, marketplaces and offline sales vary by market | State the method and its gaps per market |
| Seasonality | Ramadan or national days shift baselines | Compare with the same period in the previous year |
Creator-level and market-level views
- Creator level: cost, deliverables, reach, engagement rate, clicks, conversions, cost per result, audience in market
- Market level: totals and rates by market, against that market's objective and target
- Platform level within each market: which formats worked
- Language level where more than one language ran
- Regional summary: a short table of cost per result by market in the reporting currency, with the rate and date
Organic versus paid
When creator content is boosted as ads, report organic and paid results separately: organic shows how the creator's own audience responded, paid shows what the content achieved with targeting and budget behind it. Blending them makes creators look better or worse than they are, and makes cost per result meaningless unless ad spend is included in the cost.
Reporting windows and attribution limits
- State the window: for example, posting dates plus 14 days for clicks and conversions
- Use the same window for every market unless a market's buying cycle justifies a different one, and say so
- Collect Story and short-lived content insights before they expire
- Report tracked results as the minimum effect; note untracked channels such as marketplaces and offline sales
- Count delivered orders where cash on delivery is common
For awareness objectives, survey-based measurement with exposed and control groups is explained in measuring influencer brand lift in the GCC.
An illustrative comparison
| Market | Objective | Cost (local) | Delivered orders | Cost per order (local) | Cost per order (USD, at stated peg) |
|---|---|---|---|---|---|
| Saudi Arabia | Sales | SAR 90,000 | 600 | SAR 150 | USD 40.00 at 3.75 |
| UAE | Sales | AED 55,000 | 400 | AED 137.50 | USD 37.44 at 3.6725 |
| Kuwait | Awareness test | KWD 4,000 | Not the objective | - | Not compared on sales |
Hypothetical figures for illustration only, not Kudozz campaign results. Saudi Arabia and the UAE are compared on cost per delivered order because both had sales objectives; Kuwait is reported against its own awareness objective instead of being ranked on sales. Market context for each country, including Kuwait's new licensing rules, is in the country guides such as influencer marketing in Kuwait.
Learnings and next actions
- For each market: what worked, what didn't, and the evidence
- Which creators to rebook, drop or test further
- Which formats, platforms and languages to scale
- Where budget should move next period, and why
- What to change in tracking before the next campaign
A report outline
1. Summary: objective per market, headline results against target, key recommendations
2. Method: reporting window, attribution methods, exchange rates and dates used, known gaps
3. Market sections (one per country):
   - Objective and target
   - Creators, platforms, languages, deliverables
   - Reach, target-market reach, views and retention, engagement rate
   - Clicks, landing-page visits, conversion rate
   - Leads or orders (delivered), revenue (local currency)
   - Cost and cost per result (local currency)
   - Organic vs paid
   - Learnings and next actions
4. Regional comparison: cost per result by market in reporting currency (rate and date stated), with notes on differences in objective, size and attribution
5. Creator table: all creators, by market
6. Appendix: definitions and formulas
Conclusion
Cross-country reporting is useful only if it's fair. Report each market on its own terms, compare on rates and cost per result in a stated currency, separate organic from paid, be explicit about windows and attribution gaps, and finish with decisions. Budget decisions that follow from the report are covered in GCC influencer marketing budgets.