How to Measure Influencer Impact When Customers Buy In-Store
When the sale happens at a till, a counter or a distributor's shelf, the usual links and codes stop working. Practical ways to measure creator campaigns that drive store visits and offline purchases, what each method can and can't tell you, and how to combine them.
A large share of Indian retail still happens offline: in brand stores, multi-brand outlets, kirana shops, malls and dealer showrooms. A creator can persuade someone to visit, but the purchase happens at a counter where no tracking link reaches. That's why offline-heavy brands often under-invest in creators, or keep investing without knowing whether it works.
Quick answer
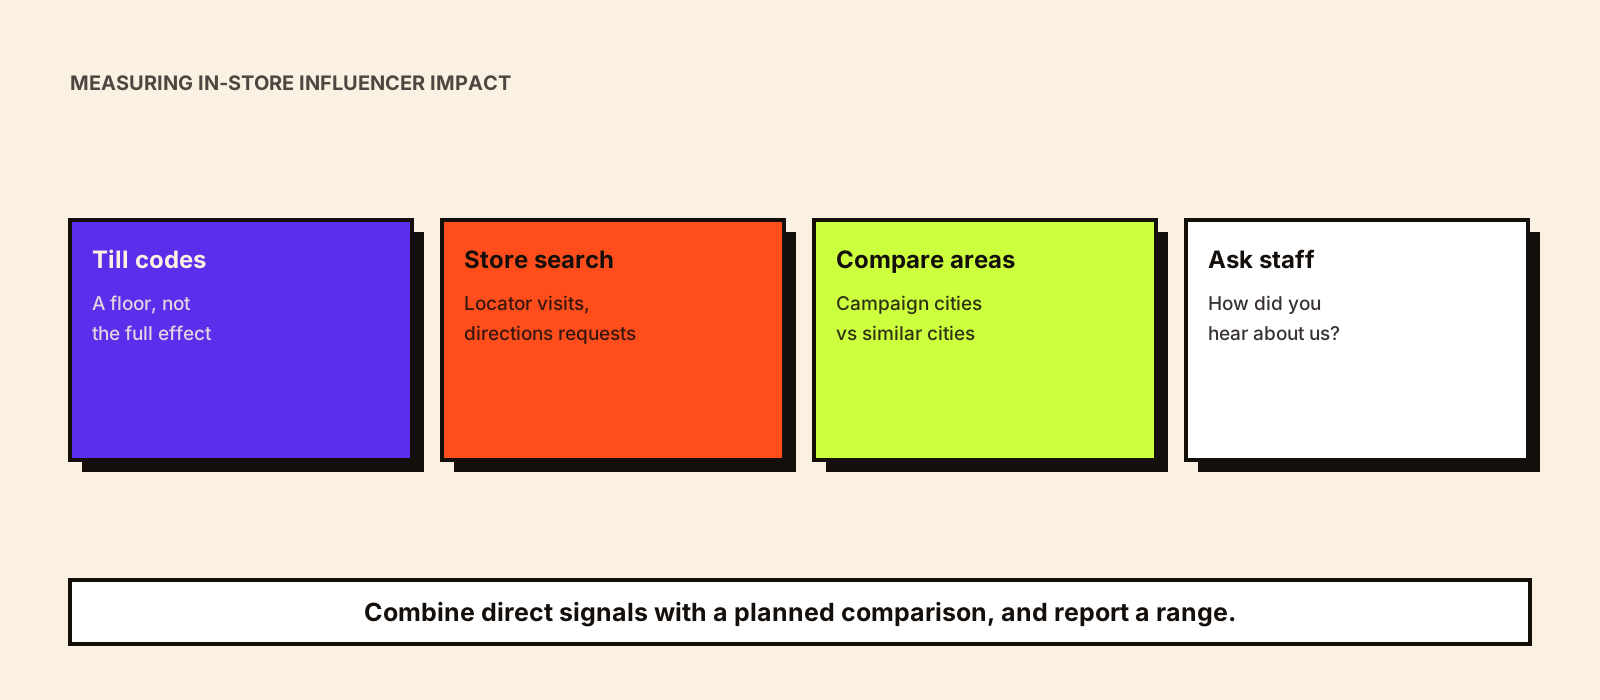
No single method captures in-store impact fully, so combine a few. Use direct signals where you can (creator codes redeemed at the till, store-locator and directions clicks, staff asking how customers heard about you) and back them with a comparison: run the campaign in some cities or store catchments and not in similar ones, then compare sales over the same period. Agree the method, the comparison areas and the measurement window before the campaign starts, and report a range rather than a single precise number.
Why in-store measurement is harder
- There's no click between the post and the purchase, so links and pixels can't follow the customer.
- Customers rarely remember, or mention, which creator they saw.
- Store sales move with weather, festivals, salary days and local events, which can hide or exaggerate a campaign effect.
- If you sell through distributors or retailers, you may only see your own shipments, not shelf sales.
- Codes undercount: many people who were influenced simply buy at full price without mentioning anything.
None of this makes measurement impossible. It means you should expect evidence, not certainty, and plan the evidence before launch.
Method 1: Codes and offers redeemed at the till
Give each creator, or each city, a code or a simple offer phrase that customers show or say at billing. This works best when your billing system can record the code against the sale; if it can't, ask staff to note it on the bill or in a shared sheet.
- Keep codes short and easy to say aloud. 'RIYA10' works; a 12-character string doesn't.
- Brief store staff before go-live, including what to do if someone mentions the creator but forgot the code.
- Treat redemptions as a floor, not the full effect. Many influenced customers won't use a code.
- Watch for code leakage to coupon sites, which inflates redemptions from people the creator never reached.
Method 2: Store-finding signals
Before visiting a store, many people look it up. Those lookups are measurable even when the purchase isn't.
| Signal | Where to find it | What it suggests |
|---|---|---|
| Store-locator page visits | Your website analytics, via UTM-tagged creator links | Intent to find a physical store |
| Directions requests and calls | Google Business Profile performance for each store | Intent to visit a specific location |
| Branded search in the city | Search Console and Google Trends, by region | Wider awareness in the creator's area |
| WhatsApp or call enquiries about stock | Store or central inbox, tagged by source | Purchase intent before the visit |
These are leading indicators. A rise in directions requests to stores in the campaign city is encouraging, but it isn't a sale. Use them alongside method 3.
Method 3: Compare campaign areas with similar areas
This is the most reliable way to estimate in-store impact, and it's simpler than it sounds. Run creators in some cities or store catchments (the test areas) and not in similar ones (the comparison areas). Then compare how sales changed in each over the same weeks. If test-area sales rose more than comparison-area sales, the difference is your best estimate of the campaign's effect. Influencer marketing incrementality explains the method in more depth.
- Pick comparison areas with similar store counts, sales history and seasonality (Pune against Ahmedabad, not Pune against a tier-3 town).
- Use creators whose audiences are concentrated in the test areas. National creators spill into every city and blur the comparison.
- Keep other activity (ads, offers, new stores) the same across test and comparison areas, or note where it isn't.
- Look at several weeks before the campaign, so you know how the areas normally move together.
- Run long enough to catch delayed visits: usually two to four weeks after the last post, longer for considered purchases.
An illustrative example
Hypothetical: a footwear brand with stores in several cities runs local creators in Pune and Nagpur, and none in Indore and Nashik, which have tracked similarly over the past year. Over the four weeks after the campaign, same-store sales rise 12% in the test cities and 4% in the comparison cities. A reasonable estimate of the campaign's effect is the difference, about 8 percentage points, with a wide margin of error because only four cities were compared. Till-code redemptions account for less than half of that estimated lift, which is normal: codes miss many influenced buyers.
Method 4: Ask customers, carefully
A one-line question at billing ('How did you hear about us today?') or on a feedback card adds useful colour. Give staff a short list of answers to tick, including 'saw it on Instagram or YouTube', and keep it optional. Self-reported answers are imperfect, people misremember and staff skip the question when busy, so use them to understand patterns, not to count sales.
Method 5: Footfall and sell-through
If your stores have footfall counters, compare visits in test and comparison stores the same way you compare sales. If you sell through retailers or distributors, ask partners for sell-out data for the campaign weeks, and compare it with your own shipments. Primary sales (what you ship) can lag or lead real demand, so they're a weak signal on their own. Influencer marketing for brands sold through distributors and retailers covers how to plan campaigns with retail partners so that this data is easier to get.
Putting the methods together
| Method | Strength | Weakness | Use it to |
|---|---|---|---|
| Till codes | Direct, creator-specific | Undercounts; can leak | Compare creators and confirm a floor |
| Store-finding signals | Quick to read, by location | Intent, not sales | Spot early whether the campaign is landing |
| Matched-area comparison | Estimates total effect | Needs planning and similar areas | Decide whether to scale |
| Customer question | Adds context | Self-reported, patchy | Understand how people found you |
| Footfall and sell-through | Covers non-code buyers | Noisy; depends on partners | Support the comparison |
A practical setup for most retail brands: codes per creator, UTM links to the store locator, Google Business Profile directions per store, and a matched-area comparison for the main decision. Retail influencer marketing in India covers how to plan the campaign itself; Kudozz's reporting service can set up this kind of measurement plan before launch.
Decision this measurement supports: [scale / repeat / stop]
Test areas: [cities or store catchments]
Comparison areas: [similar cities or catchments, with reason]
Measurement window: [pre-period weeks] before, [campaign weeks], [weeks] after last post
Primary metric: same-store sales change, test vs comparison
Supporting signals: till codes by creator, store-locator visits, directions requests, footfall
Known confounders: [festivals, offers, new stores, ad spend changes]
Owner and reporting date: [name, date]
Common mistakes
- Counting only code redemptions and concluding the campaign failed.
- Using national creators and then trying to measure a city-level effect.
- Comparing this month with last month instead of test areas with comparison areas.
- Forgetting to brief store staff on codes and the customer question.
- Choosing comparison areas after the results are in, which invites bias.
- Reporting a single precise number when the honest answer is a range.
Conclusion
In-store sales can't be tracked click by click, but they can be measured well enough to make decisions. Combine creator codes and store-finding signals with a planned comparison between campaign and non-campaign areas, set it all up before launch, and report the result as an honest range. That's enough to know whether to scale.