Influencer Marketing Incrementality: How to Measure the Sales Creators Actually Add
How to tell whether creator campaigns caused sales that wouldn't have happened anyway: holdout and geographic tests, platform lift studies, measuring without discount codes, using brand search demand as a signal, and comparing creator content with brand-made ads fairly.
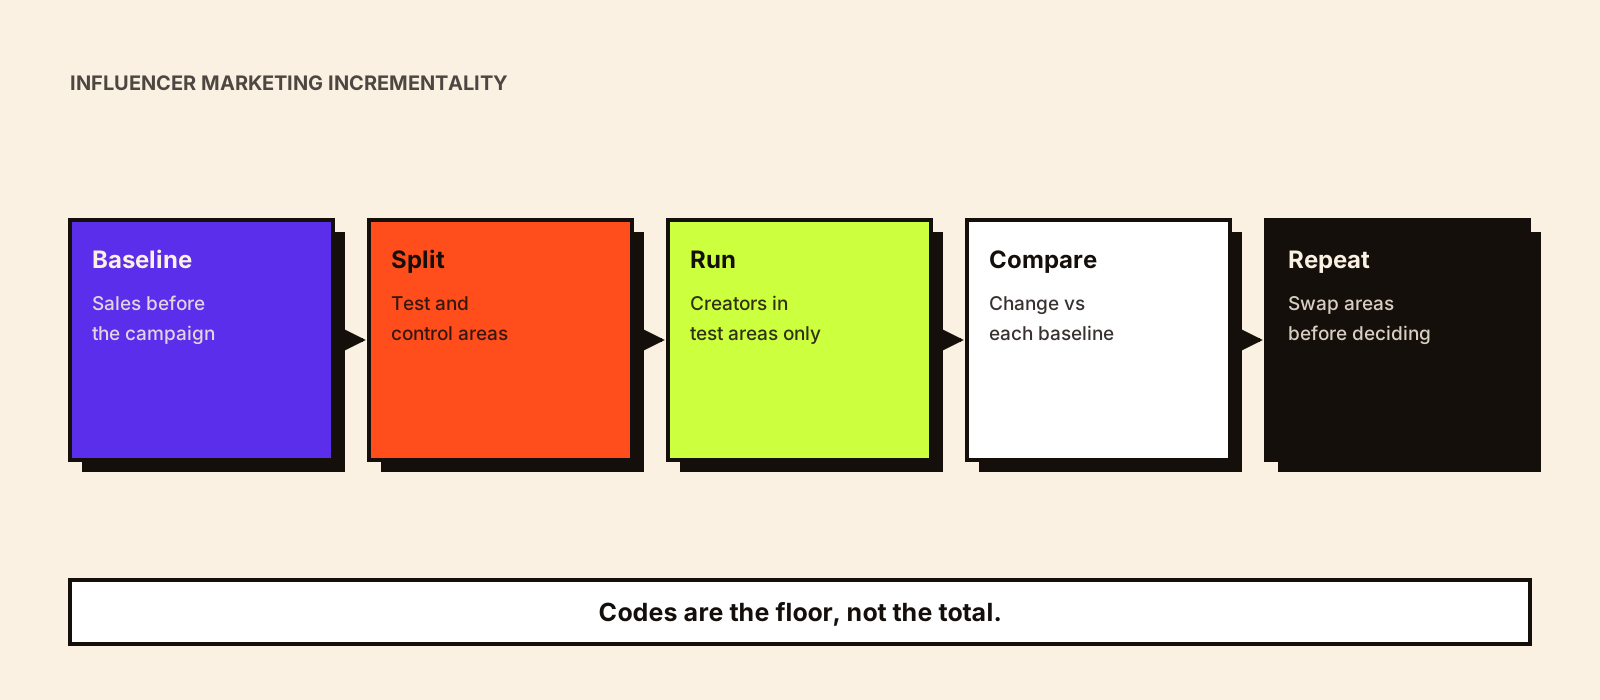
Discount codes and tracked links show some of the sales creators influence, and miss many others. They also credit creators with sales from people who would have bought anyway. Incrementality asks a narrower question: what happened because of the campaign that wouldn't have happened without it? IAB's January 2026 review of creator measurement described an industry relying on 'fragmented metrics, siloed platforms, and proxy-based ROI'. This guide explains practical ways to get closer to the real effect.
Quick answer
To measure incrementality, compare a group exposed to creator activity with a similar group that wasn't, over the same period. For creators, the most practical method is usually a geographic test: run creators who reach one set of regions, hold back comparable regions, and compare sales or sign-ups. Platform lift studies can measure paid creator ads where you have access. Brand search demand and direct traffic are useful supporting signals. Codes remain helpful, but treat them as a floor, not the total.
Attribution vs incrementality
| Attribution | Incrementality | |
|---|---|---|
| Question | Which touchpoint gets credit for a sale? | Did the campaign cause extra sales? |
| Typical tools | Codes, UTM links, platform reports | Holdouts, geo tests, lift studies |
| Weakness | Over-credits loyal buyers; misses unlinked buyers | Needs planning, scale and a control group |
| Best use | Comparing creators within a campaign | Deciding whether to keep investing in the channel |
How attribution models share credit is explained in influencer marketing attribution models, and setting up codes and links so attributed sales are counted once in how to track influencer sales.
Methods that work for creator campaigns
1. Geographic tests
Choose creators whose audiences are concentrated in particular cities, states or regions. Activate creators in test regions and hold back similar control regions. Compare the change in sales, sign-ups or store visits against each region's own baseline. This works best for brands that sell across many comparable areas and can see sales by area. It works poorly when creator audiences are national, because the control regions see the content too.
2. Platform lift studies for paid creator ads
When creator content runs as ads (for example through partnership ads), platform lift studies randomly hold back part of the audience and compare conversions. Access is limited: Google says Conversion Lift isn't available to all accounts, and Meta's lift studies are arranged through a Meta representative. See Google's Conversion Lift overview and Meta's lift studies guide. Lift studies measure the paid layer, not the creator's organic posts.
3. Time-based comparisons
Switching creator activity on and off over time (for example, alternating months) is easier but weaker, because seasonality, promotions and competitors also change. Use it only with a clear baseline and when nothing else changes in the same period.
Measuring sales without discount codes
- Ask 'how did you hear about us?' at checkout or sign-up, with creator names as options
- Compare sales in the creator's main audience regions with your baseline
- Watch new-customer share, not just total orders
- Track direct and branded search traffic during and after posts
- Look at retailer or marketplace sales where your store isn't the only channel
- Use codes as a minimum: people who use a code were influenced; many influenced people won't use one
Code and link set-up is covered in measuring influencer campaign ROI, and customer value by creator in measuring customer quality from influencer campaigns.
Brand search demand as a signal
If creators make people curious, some of them will search for your brand. Search Console's Performance report shows clicks and impressions for queries containing your brand name. Compare branded impressions during and after the campaign with the same weeks before it and with the previous year, and with regions where creators didn't run where possible. Search demand is a supporting signal, not proof: news coverage, ads and seasonality move it too. See Google's guide to the Performance report.
Comparing creator content with brand-made ads fairly
- Same objective, audience, placement and budget for both
- Run them at the same time, so the same market conditions apply
- Include the full cost of creator content (fee plus usage rights), not just media
- Compare on the outcome you care about (cost per new customer), not click-through rate alone
- Give both enough spend to reach a stable result before deciding
- Repeat the test; one round can be noise
Running creator content as ads is covered in UGC for paid social.
Hypothetical example
Hypothetical, for illustration. A brand sells online in ten similar cities. It runs local creators in five cities for four weeks and none in the other five. New-customer orders rise 18% against baseline in the test cities and 6% in the control cities, so the estimated incremental lift is about 12 percentage points. Codes captured only part of the test-city increase. The brand repeats the test with the cities swapped before changing its budget.
From lift to incremental ROI
Continuing the hypothetical example: the test cities normally produce 2,000 new-customer orders in four weeks. An 18% rise adds 360 orders, but the control cities suggest 6% (120 orders) would have come anyway, so the estimate is about 240 incremental orders. Creator codes recorded 300 orders in the test cities.
| Line (hypothetical) | Attributed (codes) | Incremental (test) |
|---|---|---|
| Orders | 300 | 240 |
| Contribution at ₹700 per order | ₹2,10,000 | ₹1,68,000 |
| Total creator cost | ₹2,00,000 | ₹2,00,000 |
| ROI = (contribution − cost) ÷ cost | 5% | −16% |
Here codes over-credited the creators, because some code users would have bought anyway. In other campaigns codes under-credit, because influenced buyers skip the code. Only the comparison tells you which. Before deciding, add the contribution from repeat purchases by these customers, and treat a single test as an estimate with a range rather than a precise figure. How to measure influencer marketing ROI shows the full cost and contribution calculation.
What research says about measuring ad effects
Two widely cited studies explain why tests matter. A 2019 Marketing Science paper compared observational measurement with 15 large randomized advertising experiments at Facebook and found the observational methods often failed to recover the experimental results, even with extensive demographic and behavioral data. An earlier study of 25 field experiments found returns to advertising so noisy that informative experiments could need over 10 million person-weeks. Neither study is about influencer marketing specifically, but both apply: attribution without a comparison group can be badly wrong, and small tests can only detect large effects.
Limits to be honest about
- Small budgets rarely produce measurable lift; results can be noise
- Creator audiences cross regional borders, which weakens geo tests
- Long purchase cycles need longer measurement windows
- Incrementality tells you the channel's effect, not which individual post caused it
Holdout results are also the best way to calibrate a marketing mix model; how to get creator data into one is covered in influencer marketing and marketing mix modeling.
Common mistakes
- Treating code sales as the whole effect, or as all incremental
- No control group, so seasonality looks like creator impact
- Changing prices or promotions during the test
- Comparing creator ads with brand ads on different budgets or audiences
- Deciding from one test
Conclusion
Attribution helps you choose between creators; incrementality tells you whether the channel is worth funding. Start with a simple geo test or a well-planned holdout, use codes and search demand as supporting evidence, and repeat tests before making big budget decisions.