How to Measure Customer Quality From Influencer Campaigns
How to judge creators on the customers they bring, not just the volume: the ladder from leads to qualified leads, first orders, net orders and retained customers, the metrics and formulas at each step, cohort comparison by creator, GCC issues such as cash-on-delivery cancellations, and how to use the results in creator decisions.
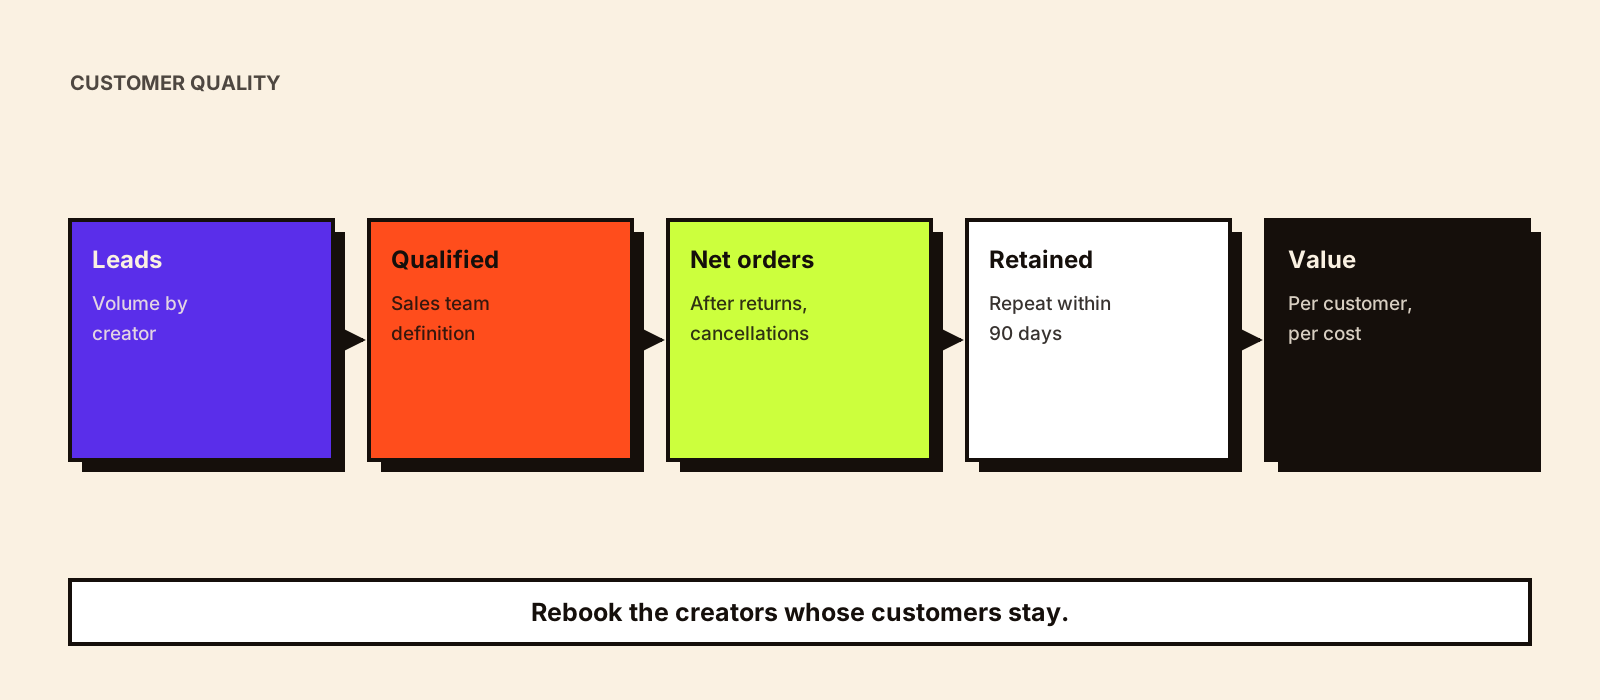
Two creators can deliver the same number of sign-ups or first orders and very different customers: one brings people who return their orders and never come back, the other brings people who buy again for years. Judging creators on volume alone rewards the first. This guide shows growth, CRM and marketing teams how to measure the quality of customers from influencer campaigns and use it in creator decisions.
Quick answer
Measure customer quality by following creator-attributed customers beyond the first conversion: qualified leads as a share of leads, net orders after returns and cancellations, repeat purchase and retention after 30, 60 and 90 days, and value per customer over a fixed window. Compare creators as cohorts over the same time window, account for small samples, and use cost per retained customer or value-to-cost ratios, not cost per lead or first order, to decide whom to rebook.
The quality ladder
| Stage | Metric | Formula |
|---|---|---|
| Leads | Lead volume | Form submissions or sign-ups attributed to the creator |
| Qualified leads | Qualification rate | Qualified leads ÷ leads (using your sales team's definition) |
| Customers | Lead-to-customer rate | Customers ÷ qualified leads |
| Net orders | Net order rate | (Orders − returns − cancellations) ÷ orders |
| Retention | Repeat purchase rate | Customers who buy again within X days ÷ customers |
| Value | Value per customer | Net revenue (or gross margin) from the cohort over X days ÷ customers |
| Efficiency | Cost per retained customer | Creator costs ÷ customers still active after X days |
For subscriptions and apps, replace repeat purchase with renewal or activity after 30 and 90 days. For B2B, use opportunities and closed deals instead of orders.
Set up the data
- Attribute each customer to a creator at the first conversion (code, link or survey) and store it in your CRM or order system
- Keep that attribution on the customer record so later orders can be traced back
- Agree definitions in advance: what counts as qualified, active or retained
- Pick a fixed window (for example 90 days) and wait for it to close before comparing creators
- Include customers who used a creator's code without clicking a link
Compare creators as cohorts
| Creator (hypothetical) | First orders | Net order rate | Repeat within 90 days | Cost per retained customer |
|---|---|---|---|---|
| Creator A | 400 | 78% | 18% | Higher |
| Creator B | 250 | 92% | 34% | Lower |
| Creator C | 60 | 95% | 40% | Too few customers to judge |
Hypothetical, for illustration only. Creator A wins on first orders, but Creator B delivers customers who keep their orders and come back. Creator C looks best on rates, but 60 customers is too small a sample to rely on; rebook for more data rather than drawing a conclusion.
Customer lifetime value and payback by creator
Repeat purchase rate tells you whether customers come back. Customer lifetime value (CLV) puts a money figure on it, so you can compare it with what the creator cost. For creator decisions, a simple historical version over a fixed window is enough; predictive models need far more data than most creator cohorts provide.
| Measure | Formula | Use it for |
|---|---|---|
| Contribution per customer (window) | Net revenue from the cohort over X days, minus variable costs, ÷ customers | The value side; use contribution, not revenue |
| Cost per new customer | Total creator cost ÷ new customers acquired | The cost side |
| Value-to-cost ratio | Contribution per customer ÷ cost per new customer | Above 1 means the cohort has paid back within the window |
| Payback period | Days until cumulative contribution from the cohort equals the creator cost | How long cash is tied up before a creator's customers pay back |
| Repeat purchase rate | Customers with 2+ orders in the window ÷ customers | Whether the creator's audience comes back |
Hypothetical example, with numbers chosen so each step can be checked. A creator costs AED 12,000 and brings 150 new customers: AED 80 per new customer. First orders produce AED 60 contribution per customer, so the cohort hasn't paid back at day 0 (ratio 0.75). By day 90, 30% have bought again, adding AED 45 contribution per repeat buyer, or AED 13.50 averaged across all 150 customers. Contribution per customer reaches AED 73.50 (ratio about 0.92). If the same repeat pattern continues, the cohort pays back somewhere in the next 90 days. A second creator whose customers rarely return might show a better first-order figure and never pay back. The same arithmetic works in any currency.
- Fix the window before comparing (for example 90 or 180 days), and only compare cohorts whose window has closed.
- Use contribution, after returns, delivery and discounts, not revenue.
- Customers acquired with a deep discount often repeat less; compare creators with similar offers.
- These are attributed customers: some would have found you anyway. For program-level decisions, pair cohort value with an incrementality test.
How to set the cost side and the break-even point is covered in break-even ROAS for influencer campaigns, and tests of what creators actually added in influencer marketing incrementality.
Limits to keep in mind
- Small cohorts swing widely; report ranges or wait for more customers
- Discount-heavy codes attract deal-seekers; compare creators with similar offers
- Seasonality matters: Ramadan or sale-period customers behave differently
- Creators influence people who never use their code; cohort data shows only tracked customers
- Product and service quality affect retention as much as the creator does
GCC-specific issues
- Cash on delivery: where you offer it, track cancellations and refusals at the door by creator; they can change the picture sharply
- Returns: fashion and electronics return rates vary by product and market; compare like with like
- Multiple markets: report by country, with values in local currency
- Language segments: Arabic and English audiences of the same creator may behave differently
Cross-country reporting is covered in GCC influencer campaign reporting, and break-even targets that include returns and COD in how to calculate break-even ROAS for influencer campaigns.
Using quality in decisions
- Rebook creators on cost per retained customer or value-to-cost ratio, with a minimum sample
- Brief creators who bring low-quality customers differently (less discount, more product education) before dropping them
- Feed quality metrics into creator scorecards
- Share results with creators; good ones want to know what works
Retention programs are covered in influencer marketing for customer retention, and cost metrics in CPM, CPE and CPA for influencer marketing.
Common mistakes
- Judging creators on cost per lead or first order only
- Comparing creators before the retention window has closed
- Drawing conclusions from a few dozen customers
- Ignoring returns and COD cancellations
- Losing the creator attribution after the first order
Conclusion
The best creators bring customers who stay. Keep creator attribution on the customer record, follow cohorts through returns, repeat purchases and value over a fixed window, and make rebooking decisions on retained customers rather than first clicks.