Influencer Benchmarking: How Brands Can Compare Creator Performance Fairly
Why one-number benchmarks like '3% engagement is good' mislead, the four kinds of benchmark worth using, how to build your own baselines by tier, format, language and objective, and how to read published benchmark reports.
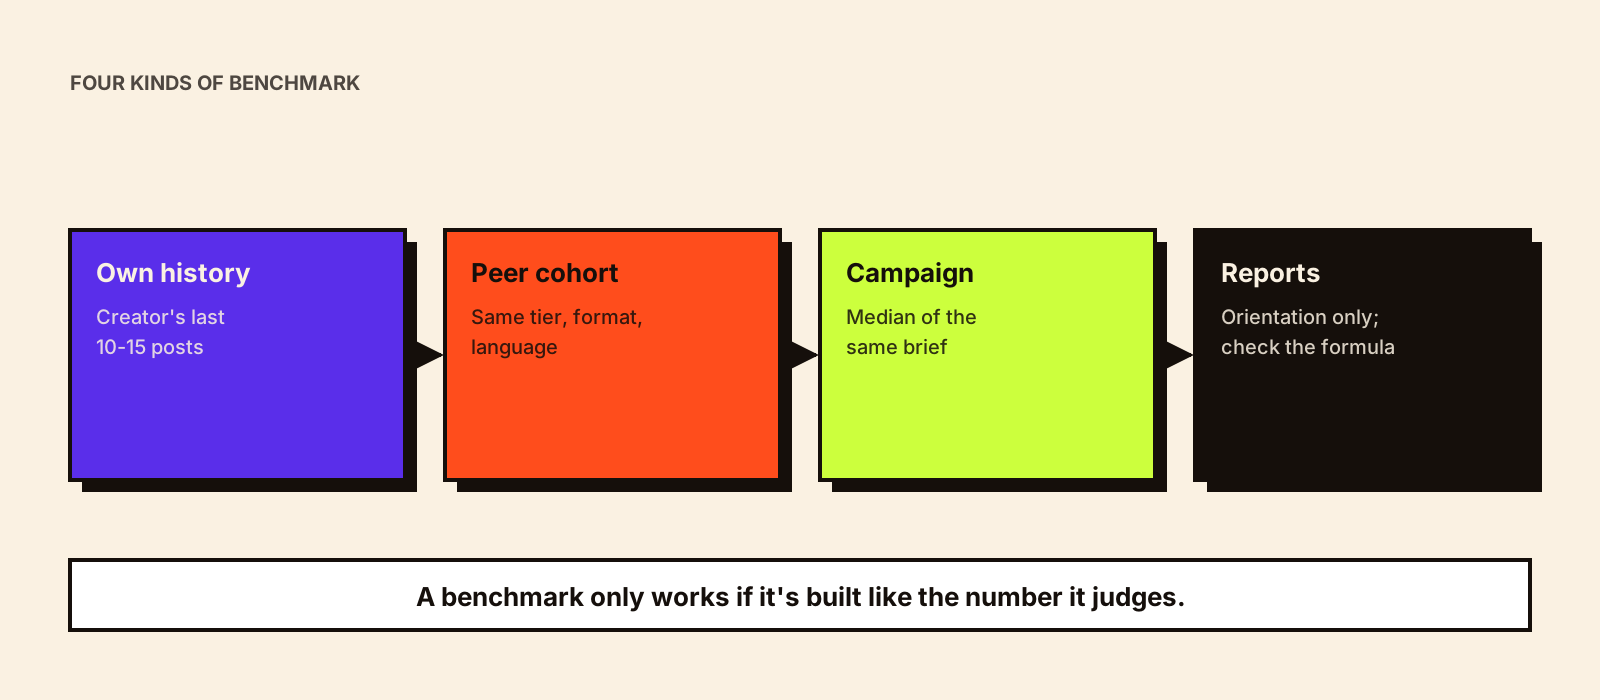
'What's a good engagement rate for an influencer?' is one of the most searched questions in influencer marketing, and most answers are a single number. The trouble is that published benchmark reports disagree with each other by several times, because they use different formulas (engagements divided by followers, reach or views), different samples, different platforms and different years. A benchmark is only useful if it's built the same way as the number you're comparing it with.
Quick answer
Fair influencer benchmarking compares a creator's result with a reference built from similar conditions: the same metric definition, platform, format, tier, language or market, objective and capture day. The most reliable benchmarks are your own: a creator's own recent history, a cohort of similar creators you've worked with, and the median of the campaign they were in. Published category benchmarks are useful for orientation only, after checking their formula and sample. There is no universal 'good' engagement rate.
Why single-number benchmarks mislead
- Formula: engagement ÷ followers and engagement ÷ views can differ several-fold for the same post.
- Tier: smaller accounts usually show higher engagement rates; comparing a nano creator with a macro benchmark flatters her.
- Format: Reels, carousels, Stories and long-form video have different interaction patterns.
- Platform: YouTube and Instagram count and distribute differently.
- Category: comedy and meme content draws likes; finance and skincare content draws saves and questions.
- Time: platform algorithm and reporting changes (such as Instagram's move to views) shift every baseline.
- Sponsored vs organic: sponsored posts typically perform differently from a creator's organic average.
Influencer engagement rate explains the formula choices in detail. The point here is that a benchmark built one way can't judge a number built another way.
Four kinds of benchmark
| Benchmark | Compares a result with | Best for | Watch out for |
|---|---|---|---|
| Creator's own history | Their median over the last 10–15 comparable posts | Did the sponsored post perform normally for this creator? | Organic vs sponsored differences |
| Peer cohort | Median of similar creators (tier, platform, format, language, category) | Vetting and shortlisting; fee negotiation | Small cohorts; cohort built on estimates |
| Campaign median | Other creators in the same campaign | Comparing creators who faced the same brief, offer and timing | Few creators per campaign |
| Published category reports | Industry samples | Orientation when you have no history | Different formulas, samples, countries and years |
Build your own baselines
Segment: Platform × Format × Tier × Language/market × Objective

For each segment record (medians, not averages):
Views per follower · Quality engagements per view · CTR · Conversion rate
CPM · Cost per quality engagement · CPC · CPA
Number of posts in the segment · Date range

Only use a segment as a benchmark once it has enough posts to be meaningful; flag thin segments.
After a few campaigns, this becomes the most valuable benchmark you have, because it's built from your products, offers and customers. Use it to set targets, judge new creators and negotiate fees. The per-campaign inputs come from influencer performance data.
Benchmarking a new creator before booking
- Calculate their median views and quality engagement per view over 10–15 recent posts in the format you're buying.
- Compare with their own sponsored posts: do sponsored posts hold up, or does the audience ignore them?
- Compare with your peer cohort for their tier, language and format.
- Compare their quoted fee with the cohort's typical CPM at their median views.
- Treat all of this as a starting point; the creator's fit and content quality still decide.
How to read a published benchmark report
- What's the formula? Engagement ÷ followers, reach or views?
- What's the sample? Countries, platforms, tiers, categories, number of accounts and posts.
- Organic or sponsored posts?
- Which period? Before or after major platform reporting changes?
- Median or average?
- Who published it, and do they sell something the benchmark supports?
Indian creator data is often under-represented in global reports, and regional-language creators even more so. Use global numbers for direction, not for targets.
Using benchmarks for targets
Set campaign targets from your own baselines where you have them: for example, 'CPM at or below our Reels micro-creator median' or 'CPA within 20% of last festival campaign'. Where you don't, set a learning target instead of a performance one: test two or three segments and use the results to build the first baseline. Influencer marketing KPIs covers target setting by objective.
A hypothetical baseline table
After a few campaigns, a brand's baseline table might look like this. The figures are invented to show structure, not to serve as benchmarks:
| Segment | Posts | Median views ÷ followers | Median CPM | Median CPA |
|---|---|---|---|---|
| Instagram Reels · micro · Hindi · sales | 24 | 0.42 | ₹410 | ₹1,350 |
| Instagram Reels · micro · Tamil · sales | 11 | 0.55 | ₹360 | ₹1,120 |
| Instagram Reels · macro · English · awareness | 6 | 0.18 | ₹520 | n/a |
| YouTube integration · micro · Hindi · consideration | 8 | 0.30 | ₹690 | ₹1,600 |
Note the post counts. The macro row is thin; treat it as provisional. The Tamil row is promising but smaller than the Hindi one, which is a reason to test more, not to conclude.
Benchmarking fees
Benchmarks also help with negotiation. Divide a quoted fee by the creator's median views to get an expected CPM, then compare it with your segment baseline. A quote well above baseline isn't automatically wrong (strong engagement quality or usage rights can justify it), but it should come with a reason. Influencer CPM, CPE, CPC and CPA has the formulas, and how much to pay influencers covers pricing factors.
Benchmarks for regional creators
- Build separate baselines by language where you have enough posts; regional audiences often behave differently from national Hindi or English ones.
- Expect different view-to-follower ratios: tight regional communities can watch more of a creator's posts.
- Don't judge a regional creator against a national cohort when the campaign was regional.
- Where data is thin, use the creator's own history as the primary benchmark.
When platforms change, rebase
Platform changes break old baselines. When Instagram moved to reporting views instead of impressions, earlier and later figures stopped being directly comparable. When a platform changes how it counts or distributes content, start a new baseline period and note the date in your table rather than mixing old and new data. Reach vs impressions vs views explains the Instagram change.
Common mistakes
- Quoting one engagement-rate threshold for every creator.
- Comparing a nano creator's rate with a macro benchmark (or the reverse).
- Using a report's averages when your data uses medians.
- Benchmarking sponsored posts against organic averages without noting it.
- Rejecting regional creators because their numbers differ from national English-language benchmarks.
If results fall below your baseline, influencer campaign underperformance covers diagnosing why.
Conclusion
A fair benchmark is built like the number it judges: same metric, platform, format, tier, market, objective and capture day. Start with the creator's own history and your campaign medians, build segment baselines over time, and treat published reports as orientation. To turn benchmarks into consistent creator evaluations, use a creator performance scorecard.