Influencer Performance Data: How to Compare Creators Across Campaigns
How to compare creators who worked on different campaigns, objectives, platforms and budgets: a normalisation method (rates, cost metrics, campaign indexes), a comparison sheet, worked example and what not to compare.
Creator A worked on your Diwali launch: one Reel, ₹1.5 lakh, 4 lakh views. Creator B worked on a quiet March campaign: a YouTube integration, ₹60,000, 70,000 views. Who performed better? On raw numbers, A. Per rupee, maybe B. For the objective each campaign had, possibly neither comparison is fair. Comparing creators across campaigns is one of the most common questions brands ask and one of the easiest to get wrong.
Quick answer
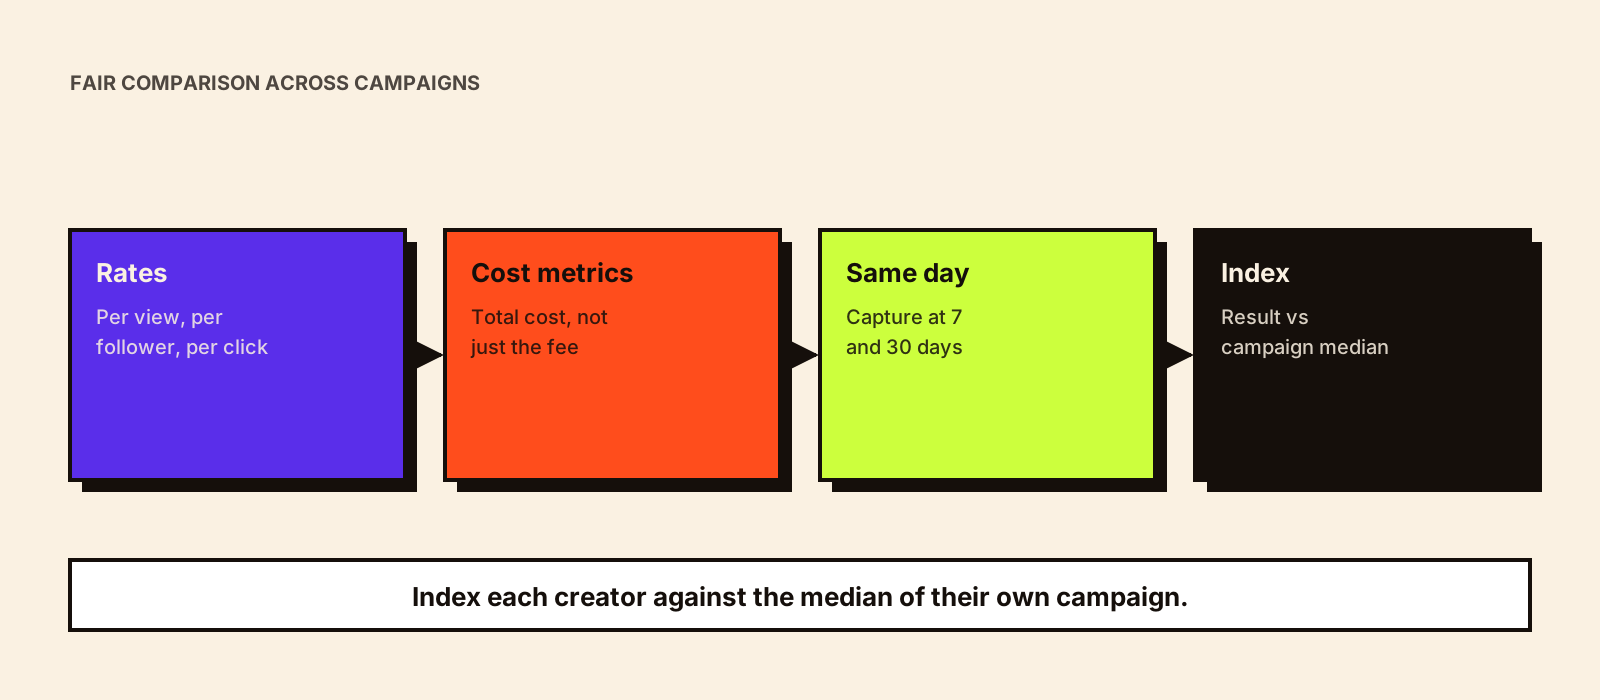
To compare creators across campaigns, convert raw results into rates and cost metrics (per view, per rupee, per follower where relevant), compare only within the same objective and format family, capture results on the same day after posting, and express each creator's result as an index against their campaign's median. A creator who delivered 1.4 times the median cost efficiency in their campaign can be compared with one who delivered 0.8 times in another. Always note the differences you couldn't adjust for: timing, offer, creative brief and platform changes.
What makes campaigns hard to compare
| Difference | Why it distorts | How to adjust |
|---|---|---|
| Audience size | Larger creators get more absolute views | Use rates (views per follower, engagements per view) and cost metrics |
| Campaign objective | Awareness and sales briefs ask for different behaviour | Compare on the metric matching each objective; don't cross-compare |
| Content format | Reels, Stories, long-form video and static posts behave differently | Compare within format families |
| Platform | Instagram and YouTube count and distribute differently | Compare within platform, or use cost per outcome |
| Spend | Higher fees should buy more | Use cost metrics (CPM, CPE, CPA) |
| Deliverables | One Reel vs a Reel plus Stories plus a link | Compare per deliverable, or total package cost per outcome |
| Audience differences | A Tamil Nadu audience for a national offer vs a regional one | Note market fit; compare within market where possible |
| Timing and offer | Sale periods, festivals, discounts | Note; compare against campaign median (index) |
The normalisation method
STEP 1: RATES
Views ÷ followers (reach efficiency)
Quality engagements (saves + shares + meaningful comments) ÷ views
Link clicks ÷ views
Orders ÷ clicks

STEP 2: COST METRICS (total cost, not just fee)
CPM = cost ÷ views × 1,000
Cost per quality engagement
CPC = cost ÷ link clicks
CPA = cost ÷ orders or leads

STEP 3: CAMPAIGN INDEX
For the campaign's primary metric:
Creator index = creator's result ÷ campaign median
(for cost metrics, invert: campaign median ÷ creator's cost, so higher is better)
1.0 = typical for that campaign; 1.5 = 50% better than typical
The index is what makes cross-campaign comparison possible. It asks 'how did this creator do relative to the others who faced the same brief, offer and timing?' rather than comparing raw numbers from different conditions.
Worked example (hypothetical)
| Creator | Campaign | Primary metric | Creator result | Campaign median | Index |
|---|---|---|---|---|---|
| A (macro, Reel) | Diwali launch (awareness) | CPM | ₹375 | ₹520 | 1.39 |
| B (micro, YouTube) | March education (consideration) | Cost per save + share | ₹48 | ₹40 | 0.83 |
| C (micro, Reel, Marathi) | Diwali launch (awareness) | CPM | ₹610 | ₹520 | 0.85 |
| D (micro, Reel, Hindi) | Summer sale (sales) | CPA | ₹1,100 | ₹1,600 | 1.45 |
For cost metrics, the index is campaign median ÷ creator cost (A: 520 ÷ 375 ≈ 1.39). The figures are invented for illustration. Read together: A and D outperformed their campaign peers; B and C underperformed theirs. That's a fairer basis for rebooking than raw views, though still not a verdict. B may have been briefed on a topic her audience cares less about, and C's Marathi audience may have been the right audience for a different offer.
Capture rules that make comparison possible
- Same capture days for every creator: 7 and 30 days after posting.
- Total cost includes product, shipping, rights and production, not just fee.
- Engagement defined once: which actions count, and divided by what.
- Views from creator insights, not third-party estimates.
- Clicks from your analytics via UTM, not platform 'taps'.
- Delivered orders, not placed orders, for COD-heavy categories.
Influencer marketing data lists the full dataset and collection points. Reach vs impressions vs views explains why view counts aren't comparable across older and newer Instagram data.
Comparing across platforms
Instagram and YouTube views aren't equivalent units: a view counts differently, attention differs, and long-form integrations last longer. Within-platform comparisons are more reliable. When you must compare across platforms, compare on outcomes both can produce (cost per click, cost per order or cost per qualified lead) and note the format difference beside the number.
A comparison sheet
Creator | Platform | Format | Campaign | Objective | Market/language | Total cost | Capture day |
Views | Views/follower | Quality engagements/view | CTR | Conv. rate |
CPM | Cost/quality eng. | CPC | CPA |
Campaign median (primary metric) | Index | Notes on differences not adjusted for
What not to compare
- A seeding post with a paid integration (different incentives and expectations).
- Organic posts with posts boosted by paid media, unless you separate organic and paid results.
- Results captured on different days.
- Creators on different objectives using one metric.
- This year's Instagram views with figures from before Instagram's switch to views reporting, without noting the change.
Handling multi-deliverable packages
Creators are often booked for a package: a Reel, three Stories and a link in bio. To compare at deliverable level, split the cost. Two common approaches:
| Method | How | When to use |
|---|---|---|
| Rate-card split | Allocate cost using the creator's own quoted per-deliverable rates | When the creator quoted individually |
| Outcome split | Compare the whole package cost with total outcomes | When deliverables work together (Stories driving to the Reel's link) |
Whichever you choose, use the same method for every creator in the comparison and note it on the sheet.
Separate organic and paid results
If a creator's post was boosted as a partnership ad, its views and clicks include paid distribution. Record organic and paid results separately where the platform allows, and compare creators on organic performance unless every post received the same paid support. Influencer marketing for performance marketing covers running creator content as ads.
Small samples
- One post is weak evidence of a creator's typical performance. Two or three campaigns are much better.
- A campaign with four creators has a fragile median; one unusual result moves it a lot.
- Flag comparisons built on thin data rather than dropping them.
- Prefer ranges ('index between 1.1 and 1.4 across three campaigns') over single figures.
Hypothetical example: same creator, two campaigns
Hypothetical: a Gujarati food creator scores an index of 1.5 on a regional snack launch and 0.7 on a national health-drink campaign. Averaging gives 1.1, which hides the useful finding: she's excellent for regional food and weak for national wellness. Keep results by campaign type, not just a lifetime average, so the next booking matches what she's good at.
Influencer data analytics covers cohort and content analysis built on these comparisons.
Common mistakes
- Ranking creators by raw views across campaigns of different sizes.
- Using fee instead of total cost.
- Treating a single campaign's index as a permanent rating.
- Ignoring market fit: a creator can underperform on a national brief and excel on a regional one.
Conclusion
Fair comparison across campaigns comes from rates, total-cost metrics and an index against each campaign's median, captured on the same days with the same definitions. It won't remove every difference, so note what you couldn't adjust for. To build a lasting record from these comparisons, use a creator performance scorecard, and for the reference points you compare against, see influencer benchmarking.