Influencer Data Analytics: How Brands Can Turn Creator Data Into Campaign Insights
Seven practical analyses that turn influencer data into decisions: role and objective fit, cost efficiency, creator cohorts, content and hook analysis, audience overlap, comment themes and funnel diagnosis, with an insight template.
Most influencer reports describe what happened: views, engagement, clicks, a top-performing post. Few explain why, or what to do differently. The difference isn't more data or a better tool. It's asking specific questions of the data you already have.
Quick answer
Turn influencer data into insights by asking decision-shaped questions and answering them with comparisons, not totals. The most useful analyses are cost efficiency by creator and role, cohort comparisons (tier, language, format, platform), content and hook analysis, audience overlap, comment-theme analysis and funnel diagnosis (where people dropped off between view and purchase). Each insight should state what was found, how confident you are, why it probably happened and what you'll change next time.
If you're choosing the tools that produce the data, see influencer analytics tools. This article is about what to do with the numbers once you have them.
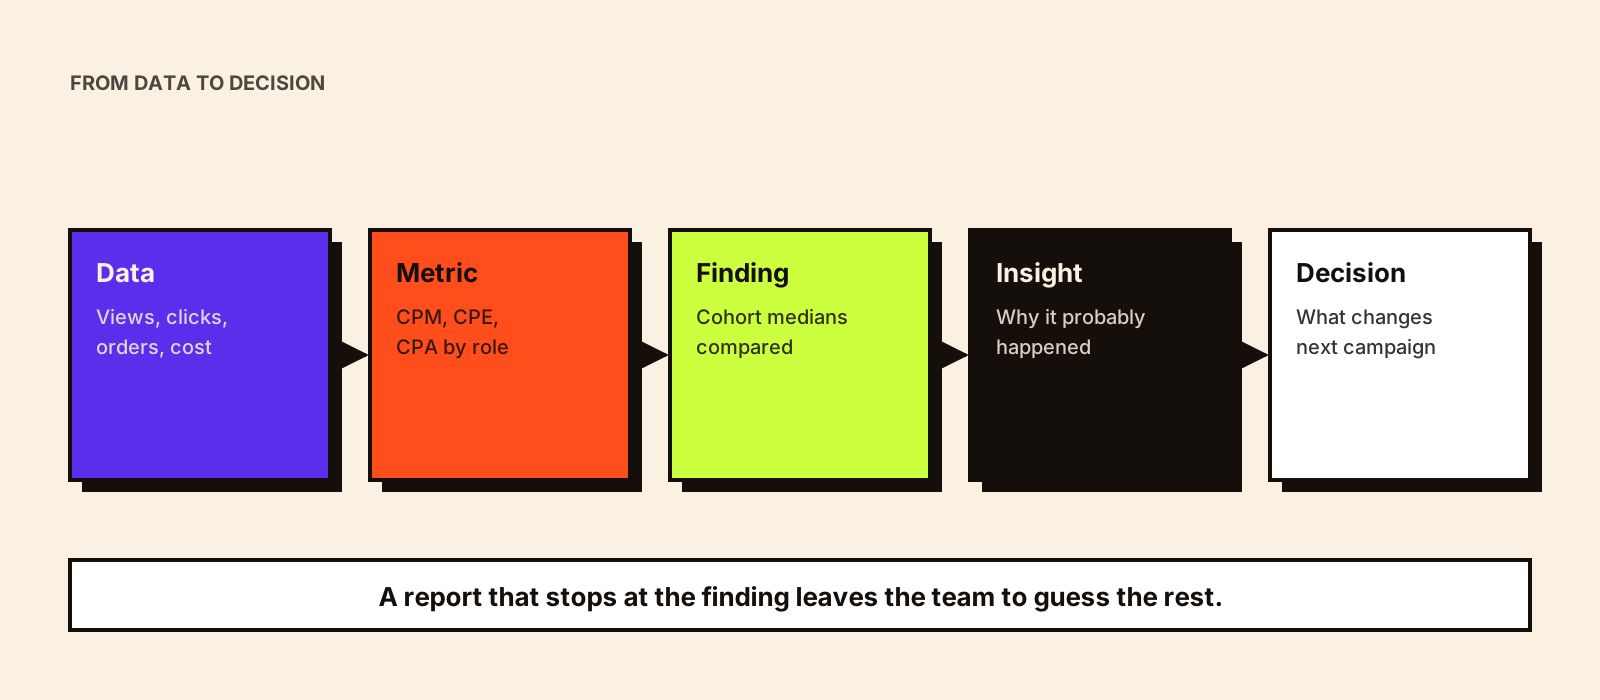
From data to insight
| Level | Example | Useful? |
|---|---|---|
| Data | Creator B: 62,000 views, 31 orders | Raw material |
| Metric | Creator B: CPA ₹1,129 | Comparable |
| Finding | Hindi micro creators delivered lower CPA than the macro creator | Interesting |
| Insight | Audiences concentrated in our delivery states converted; national reach didn't. Likely because the offer was region-specific. | Explains |
| Decision | Next launch: shift budget to regional micro creators in delivery states; keep one reach creator | Acts |
The example figures are illustrative. The point is the progression: a report that stops at 'finding' leaves the team to guess the rest.
Seven analyses worth running
1. Cost efficiency by creator and role
Calculate the cost metric that matches each creator's role: CPM for reach drivers, cost per save or share for trust builders, CPA for converters. Comparing a reach creator's CPA with a converter's is unfair to both. Influencer CPM, CPE, CPC and CPA has the formulas.
2. Cohort comparisons
Group creators by tier, language, region, platform or format and compare median results, not averages. Medians stop one viral post from distorting the picture. Typical questions: did regional-language creators outperform Hindi-national creators on cost per order? Did YouTube integrations drive more considered comments than Reels?
3. Content and hook analysis
Tag every post by content variables: hook type (problem, result, question, trend), when the product appears, demo or no demo, length, language, call to action. Then compare results across tags. With enough posts this shows which creative patterns work for your product, which is often more useful than knowing which creator performed.
4. Audience overlap
If several creators share audiences, you're buying frequency rather than reach. Signals include the same commenters across creators, shared collaborators and similar audience geography. Overlap isn't bad for a conversion push, where repetition helps, but it inflates reach estimates for awareness campaigns.
5. Comment theme analysis
Code a sample of comments per creator into questions, objections, purchase intent, praise and off-topic. Compare the mix across creators and between sponsored and organic posts. A creator whose sponsored comments are full of price and availability questions is generating demand; one whose comments ignore the product isn't, whatever the engagement rate. Influencer sentiment analysis covers this in depth.
6. Funnel diagnosis
| Pattern | Likely problem | Where to look |
|---|---|---|
| High views, low clicks | Weak call to action, link hard to find, low intent audience | Creative, CTA placement, audience fit |
| High clicks, low orders | Landing page, price, offer, stock, delivery coverage | Site, not the creator |
| High orders, high returns or cancellations | Expectation mismatch or offer abuse | Claims, product fit, code rules |
| Good results early, nothing after day 7 | Short shelf life of format | Format mix; consider paid amplification |
7. Time and decay
Compare day 7 and day 30 results. YouTube videos and searchable content often keep accumulating views; Stories don't. Knowing each format's decay curve for your category improves budget decisions and stops teams from undervaluing long-tail formats.
How confident should you be?
- Small samples: three creators per cohort is an anecdote, not a pattern. Say so.
- Confounders: a creator who posted during a sale will look better than one who didn't.
- Attribution gaps: link and code tracking misses people who buy later or on marketplaces.
- Selection bias: if you only rebook winners, your 'repeat creators perform better' finding is partly built in.
- Novelty: first-time results for a product often differ from repeat campaigns.
Label each insight high, medium or low confidence. It keeps leadership from over-reacting to a single campaign and tells you which insights to test next.
An insight template
FINDING: What the data shows (with numbers and comparison group)
CONFIDENCE: High / Medium / Low, and why (sample size, confounders)
LIKELY REASON: What probably caused it
DECISION: What we'll do differently
TEST: How the next campaign will confirm or disprove it
Indian campaign specifics
- Analyse by language and state, not just by creator. Regional results are often hidden inside national totals.
- For COD-heavy categories, analyse delivered orders, not placed orders.
- Separate marketplace sales from D2C site sales; creator impact may show up in marketplace search and sales your tracking can't attribute.
- Festival and sale periods distort comparisons; compare like with like.
Worked example: a post-campaign analysis
Hypothetical: a personal-care brand ran a 12-creator launch across Hindi, Marathi and Tamil creators on Instagram and YouTube. A totals-only report would say 'total views 18 lakh, 640 orders, CPA ₹1,400'. An analysis asks better questions:
| Question | Analysis | Hypothetical finding | Decision |
|---|---|---|---|
| Which role worked? | Cost metric by role | Two reach creators delivered low CPM; converters drove most orders | Keep both roles; don't judge reach creators on CPA |
| Which segment worked? | Cohort medians by language | Tamil creators had the lowest median CPA | Expand Tamil creators next launch |
| Which content worked? | Hook and demo tags vs results | Posts showing the product in the first 3 seconds had higher click rates | Brief: product early, no long setup |
| Where did people drop off? | Funnel by creator | One creator: high clicks, few orders; landing page was in English only | Fix landing page language, not the creator |
| What did audiences ask? | Comment themes | Many questions about use during monsoon | Add monsoon usage to brief and FAQ |
The numbers are invented. The structure, five questions leading to five decisions, is what a useful analysis looks like.
An analysis cadence
| When | Analysis | Purpose |
|---|---|---|
| During the campaign (weekly) | Early views, clicks, comment themes | Fix briefs, links or landing pages while there's time |
| 30 days after the last post | Full analysis and scorecards | Rebooking and next-campaign decisions |
| Quarterly | Cohort baselines, content patterns across campaigns | Budget allocation and creator mix |
| Annually | Market map, competitor review, programme results | Strategy and planning |
The live view during campaigns is covered in influencer marketing dashboard; the end-of-campaign document in influencer marketing report.
Presenting insights to leadership
- Lead with the decision you recommend, then the evidence.
- Show comparisons (against baseline, cohort or target), not standalone totals.
- State confidence plainly: 'one campaign, five creators, medium confidence'.
- Separate creator performance from offer, landing page and timing effects.
- End with the test that will confirm or disprove the insight.
A campaign learnings register
Insights only help if they reach the next campaign. A simple register, kept across campaigns, stops learnings from disappearing when people move on:
Date · Campaign · Learning (one sentence) · Evidence (numbers, comparison group) · Confidence (high / medium / low) · Applies to (brief / creator selection / offer / process / platform) · Decision (keep / change / test) · Owner · Status · Confirmed in later campaign? (yes / no / contradicted)
- Write each learning as a sentence someone could act on: 'Hindi micro creators delivered lower cost per order than macro creators in two festive campaigns', not 'micro is good'.
- Upgrade confidence only when a later campaign confirms it.
- Mark contradicted learnings; they're as useful as confirmed ones.
- Review the register when writing every brief and shortlist.
Influencer campaign post-mortem covers the review that produces these learnings, and influencer marketing testing covers confirming them deliberately.
Common mistakes
- Reporting totals instead of comparisons.
- Judging every creator on one metric regardless of role.
- Averages dragged by one viral post.
- Blaming creators for landing page or offer problems.
- Presenting low-confidence findings as conclusions.
Conclusion
Influencer data analytics is the step between a report and a better next campaign. Ask decision-shaped questions, compare cohorts with medians, analyse content and comments as well as numbers, diagnose the funnel before blaming creators, and state your confidence. For comparing creators across different campaigns fairly, see influencer performance data; for setting reference points, see influencer benchmarking.