Influencer Marketing Dashboard: What Data Should Brands Track in One Place?
What an influencer marketing dashboard should show for leadership, campaign managers and finance, the metrics by objective, a layout you can copy, data sources and refresh rules, and the mistakes that make dashboards misleading.
An influencer marketing dashboard should answer one question at a glance: is our creator spend working, and where? Most dashboards answer a different question, 'what numbers do we have?', and end up as walls of likes and follower counts that nobody acts on. The difference is deciding who the dashboard is for and what decisions it should support before choosing a single chart.
Quick answer
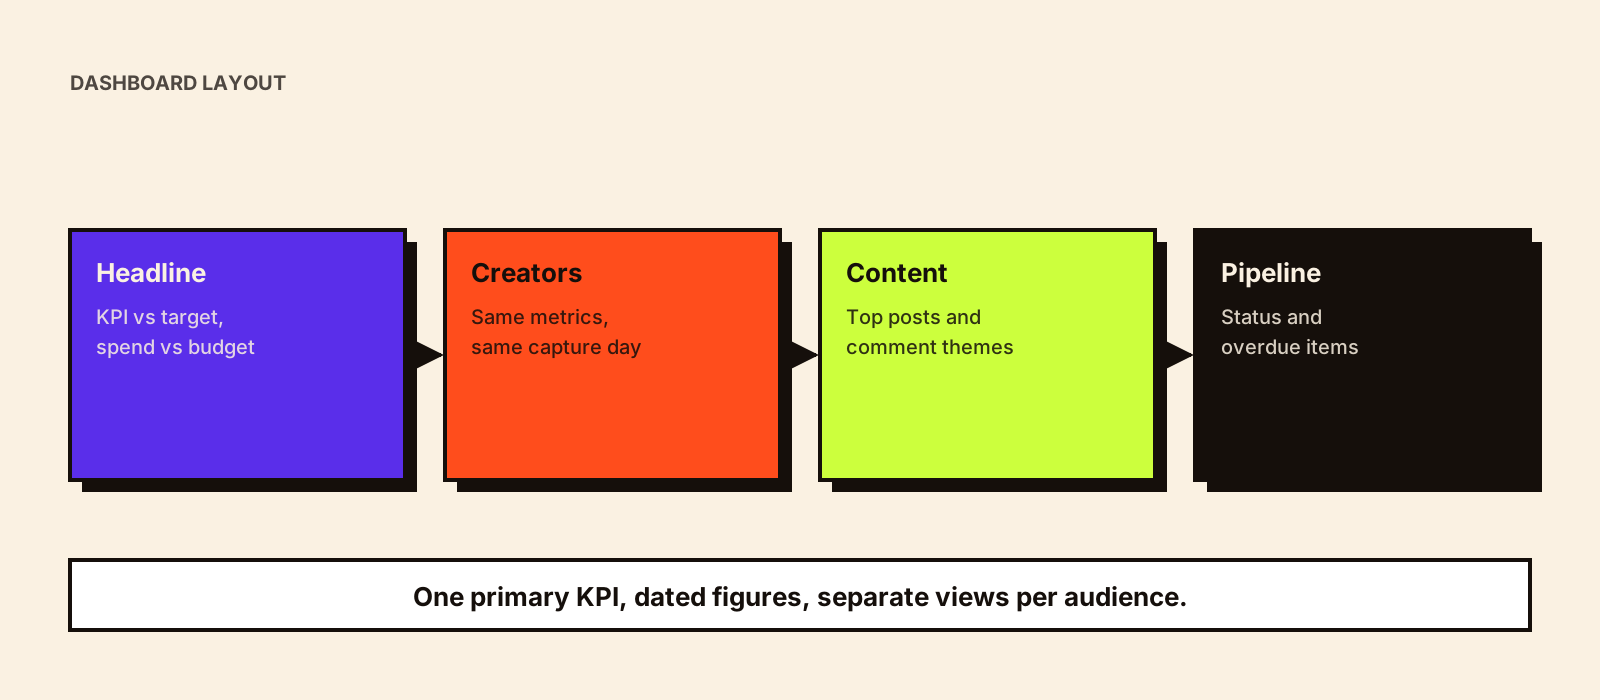
An influencer marketing dashboard should track, in one place: the campaign's primary KPI against target, total spend and cost-efficiency metrics (CPM, CPE, CPC or CPA depending on the objective), per-creator performance on the same metrics, content delivered and live, and campaign pipeline status. Add audience response (comment themes, questions) and, for sales campaigns, tracked revenue and orders. Every figure should show its source and capture date. Build separate views for leadership (outcomes and cost), campaign managers (creator-level detail and pipeline) and finance (spend and payments).
Dashboard vs report
A dashboard is live and for monitoring: it shows what's happening now so the team can act during a campaign. A report is a point-in-time document that explains what happened and why, with recommendations. You need both. Influencer marketing report covers the report; this guide covers the live view.
What to track by objective
| Objective | Primary KPI | Supporting metrics | Cost metric |
|---|---|---|---|
| Awareness | Reach or views | Frequency, audience in target markets, completion rate | CPM |
| Consideration | Quality engagements (saves, shares, meaningful comments) | Engagement rate (method stated), comment themes | CPE |
| Traffic | Link clicks / sessions | Engaged sessions, landing page behaviour | CPC |
| Sales | Orders or revenue (tracked) | Conversion rate, code redemptions, new vs returning customers | CPA, ROAS |
| Content for ads | Ad performance of creator assets | Hook rate, thumb-stop, CTR in paid | Cost per usable asset |
Pick one primary KPI per campaign and make it the biggest number on the screen. Influencer marketing KPIs covers how to choose it, and influencer CPM, CPE, CPC and CPA has the formulas.
A layout you can copy
ROW 1: HEADLINE
[Primary KPI vs target]  [Total spend vs budget]  [Main cost metric]  [Content live: x of y]

ROW 2: CREATOR TABLE (sortable)
Creator · tier · language · fee · deliverables live · views/reach · quality engagements · clicks · orders · CPM/CPE/CPA · capture date

ROW 3: CONTENT
Top 5 posts by primary KPI (thumbnail, link, why it worked)
Comment themes: questions · objections · purchase intent

ROW 4: PIPELINE
Creators by status: contracted · briefed · draft · approved · live · insights · paid
Overdue items

ROW 5: TREND (always-on programmes)
Primary KPI and cost metric by month
Different views for different people
| Audience | What they need | What to leave out |
|---|---|---|
| Leadership | Primary KPI vs target, spend, cost efficiency, trend over time, top creators | Status detail, raw engagement counts |
| Campaign managers | Creator-level metrics, pipeline, overdue items, comment themes | Long-term trend charts |
| Finance | Spend by creator, payments due and paid, cost metrics | Engagement detail |
| Creative / paid media | Top-performing content, assets with usage rights | Pipeline status |
Data sources and refresh rules
| Data | Source | Refresh |
|---|---|---|
| Reach, views, engagements | Creator insights (screenshots or connected accounts) | Fixed capture points, e.g. 7 and 30 days after posting |
| Clicks and sessions | Web analytics via UTM links | Daily during campaign |
| Orders and revenue | Store or marketplace data via codes and links | Daily during campaign |
| Spend | Contracts and payments | When contracts change |
| Status | Campaign tracker | Live |
| Comment themes | Comment analysis or manual tagging | Weekly |
The capture-date rule matters most. A creator whose post went live yesterday will always look worse than one who posted three weeks ago. Compare creators at the same number of days after posting, and show the capture date next to every figure. Influencer analytics tools covers where each data type comes from.
What to leave off
- Follower counts as a performance metric; they describe creators, not results.
- Total likes without context; they rarely drive a decision.
- Estimated impressions from third-party tools presented as delivered results.
- More than about five headline numbers; beyond that, nothing stands out.
- Metrics nobody has agreed how to calculate.
Make it drive decisions
A dashboard earns its place when it changes what the team does during a campaign. Agree in advance which signals trigger which actions:
- A creator's content beats the campaign's average cost metric by a wide margin → consider whitelisting it as a paid ad or booking a follow-up post.
- Clicks are strong but orders are weak → check the landing page, price or offer, not the creator.
- Comment themes show a recurring objection → brief remaining creators to address it.
- Overdue drafts pile up → escalate before go-live dates slip.
- Spend is ahead of results → pause remaining bookings and review.
Moving winning content into paid media is covered in UGC whitelisting and creator licensing, and budget shifts in influencer budget allocation.
Building it: tools and effort
You don't need specialist software to start. A shared spreadsheet with a summary tab, or a free dashboard tool connected to it, covers most needs if the underlying tracker uses the same fields for every creator. Influencer marketing software with built-in dashboards saves setup time when you run many campaigns. The hard part is never the charts; it's collecting consistent, dated data from creators, analytics and the store. Kudozz's reporting service, for example, consolidates every creator's performance into a single dashboard and tracks it against the KPI agreed at kickoff.
Example: a creator table that tells a story
Illustrative figures for a sales campaign, chosen to show how the table should be read, not as benchmarks:
| Creator | Cost (₹) | Views (7d) | Sessions | Delivered orders | CPA (₹) |
|---|---|---|---|---|---|
| Creator A (macro) | 1,50,000 | 4,20,000 | 2,100 | 48 | 3,125 |
| Creator B (micro, Hindi) | 35,000 | 62,000 | 940 | 31 | 1,129 |
| Creator C (micro, Marathi) | 30,000 | 48,000 | 610 | 22 | 1,364 |
| Creator D (mid-tier) | 80,000 | 1,10,000 | 420 | 6 | 13,333 |
Read together, the table suggests that smaller regional creators delivered customers more cheaply, Creator A delivered reach at a reasonable CPA, and Creator D's traffic didn't convert (worth checking the link, landing page and audience before judging the creator). A dashboard that showed only views would have ranked Creator D second.
Dashboards for always-on programmes
For ongoing programmes, add a monthly trend view: primary KPI and cost metric by month, share of spend on repeat vs new creators, and performance of repeat creators over time. This shows whether the programme is getting more efficient as you learn, which is the main argument for always-on creator marketing. Always-on influencer marketing covers how those programmes are structured.
Questions leadership will ask
- Did we hit the target, and what did it cost per result?
- Which creators should we work with again?
- How does this compare with our other channels on the same metric?
- What will we change in the next campaign?
If the dashboard can answer these four without a meeting, it's doing its job.
The operational view: campaign status in one place
Performance dashboards answer 'is it working?'. During a live campaign, teams also need an operational view that answers 'is it on track?'. Build it from the same tracker so both views agree:
| Panel | Shows | Action it prompts |
|---|---|---|
| Creators by status | Counts at each stage (contracted, briefed, draft, approved, live, paid) | Spot stages where work piles up |
| Due soon | Drafts, feedback and go-lives due in the next 3 days | Chase before anything is late |
| Overdue | Anything past its date, with owner | Escalate or re-plan |
| Waiting on brand | Drafts awaiting feedback; invoices awaiting approval | Clear internal bottlenecks |
| Go-live calendar | Posts scheduled by day and region | Check pacing; avoid clashes |
| Issues open | Escalations and non-compliance items | Follow through to closure |
| Payments | Due, overdue, paid | Protect creator relationships |
Influencer campaign tracker covers the underlying data, influencer campaign delays covers interpreting where work waits, and creator payment tracking covers the payments panel.
Common mistakes
- Building the dashboard after the campaign instead of before launch.
- Comparing creators at different days after posting.
- Mixing estimated and creator-provided figures without labels.
- One dashboard for everyone, which serves nobody well.
- No owner, so data stops being updated mid-campaign.
For comparing creators fairly on the dashboard, see influencer performance data, which explains campaign indexes and capture rules.
For what you can realistically change once the dashboard shows a problem during a live campaign, see mid-campaign optimization.
Conclusion
A useful influencer dashboard puts the primary KPI, spend, cost efficiency, creator-level results, content and pipeline in one place, with dated, sourced figures and separate views for each audience. Set it up before launch, agree the actions each signal should trigger and keep it updated during the campaign. Measuring influencer campaign ROI covers how to turn dashboard data into a return figure.