Influencer Analytics Tools: How Brands Can Choose the Right Reporting Technology
The types of influencer analytics tools (native insights, connected-account data, tracking and attribution, social analytics, BI dashboards), what each can and can't measure, and how to choose a setup that matches your KPIs.
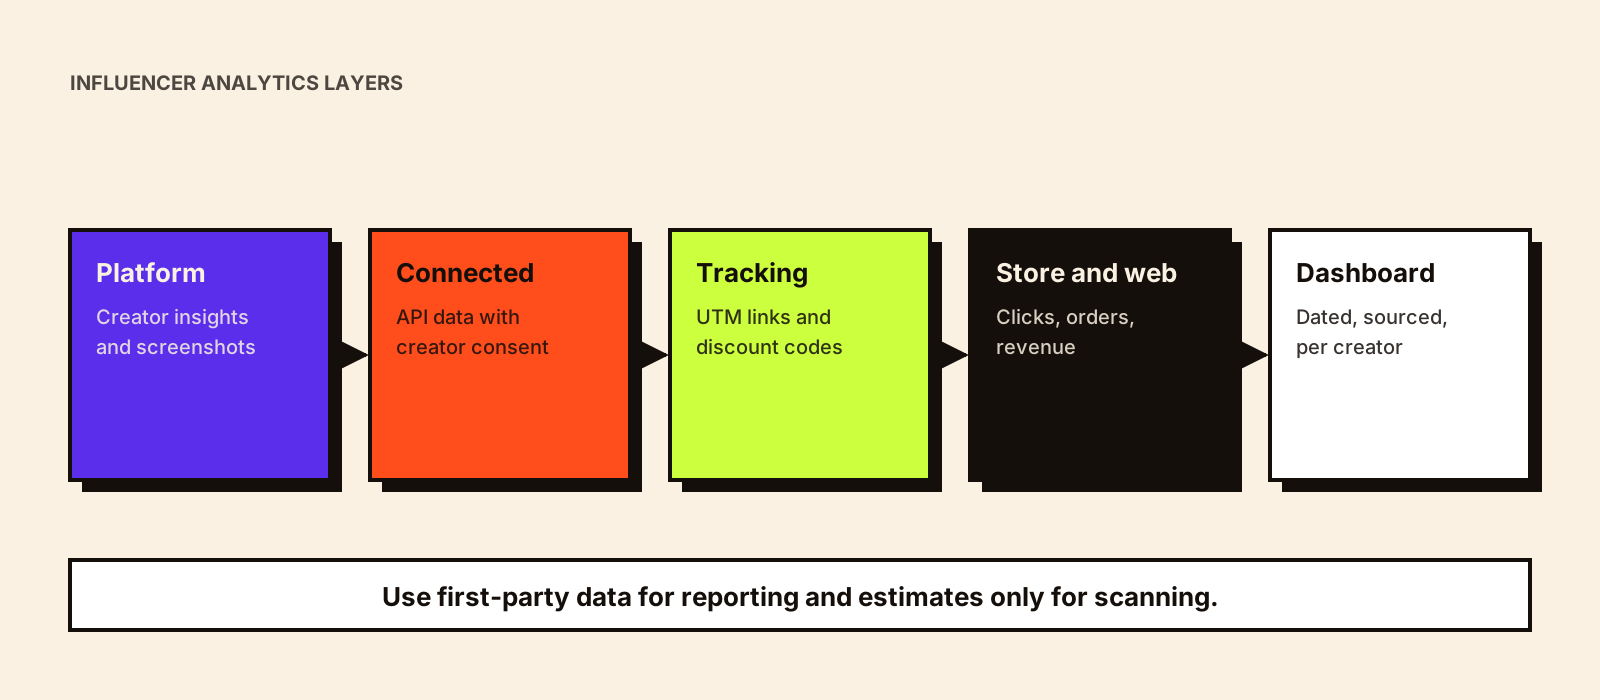
Brands often buy influencer analytics tools hoping for one number that proves a campaign worked. What they get is a set of partial views: the platform knows views and engagement, your website knows clicks and sessions, your store knows orders. Choosing reporting technology is really about deciding which of those views you need for your KPIs and how to connect them reliably.
Quick answer
Influencer analytics tools fall into five types: native platform insights (what creators see), connected-account data (insights shared directly from creator accounts through platform APIs), tracking and attribution (UTM links, codes, affiliate links), social and content analytics (public engagement, comments, sentiment) and dashboards that combine them. Pick tools based on your KPIs: awareness needs reliable reach and views from creators; consideration needs engagement quality and clicks; sales needs links, codes and store data. Prefer first-party data over estimates, define metrics before launch and make sure every number has a source and a capture date.
The five types of influencer analytics
| Type | What it measures | Strengths | Limits |
|---|---|---|---|
| Native platform insights | Reach, views, interactions, audience demographics, link taps | The platform's own numbers | Private to the creator; shared as screenshots unless connected |
| Connected-account data | The same insights, pulled through platform APIs with creator permission | Accurate, consistent, less manual | Only for creators who connect; API access varies by platform |
| Tracking and attribution | Clicks, sessions, conversions via UTM links, codes, affiliate links | Ties creators to business outcomes | Misses people who buy later without the link or code |
| Social and content analytics | Public engagement, comments, mentions, sentiment, growth | Works without creator cooperation; good for benchmarking | Public data only; sentiment is approximate |
| Dashboards and BI | Combines the above per creator and campaign | One view; trends over time | Only as good as the inputs |
Start from KPIs, not tools
| Objective | KPIs | Data you need | Tool type |
|---|---|---|---|
| Awareness | Reach, views, frequency, CPM | Creator insights | Native insights or connected accounts |
| Consideration | Engagement quality, saves, shares, comments, CPE | Creator insights, comment analysis | Native insights + social analytics |
| Traffic | Clicks, sessions, engaged sessions, CPC | UTM links, web analytics | Tracking + web analytics |
| Sales | Orders, revenue, CPA, ROAS | Codes, affiliate links, store data | Tracking + store analytics |
| Content for ads | Ad performance of creator content | Ads manager data | Ads platform reporting |
Influencer marketing KPIs explains how to choose these, and influencer CPM, CPE, CPC and CPA has the formulas. Reach vs impressions vs views explains Instagram's switch to views.
First-party data vs estimates
Many analytics tools estimate reach or impressions from public engagement when they don't have the creator's own data. Estimates are useful for scanning many creators; they're not good enough for reporting what a campaign delivered or for paying on performance. For reporting, use creator-provided insights (screenshots or connected accounts) and your own tracking data. Make sure your tool labels which numbers are which.
Tracking setup that works
- One UTM-tagged link per creator per platform, with consistent naming (source = creator handle, medium = influencer, campaign = campaign name).
- One discount code per creator if codes are part of the offer; codes catch purchases from people who don't click.
- Landing pages that load fast on mobile data and match what the creator promised.
- Store and web analytics set up to record conversions from those links and codes.
- A fixed capture date for creator insights, for example 7 and 30 days after posting.
- A note on what tracking misses: people who see a post, then search for the brand or buy on a marketplace days later.
The attribution gap is real, especially for Indian brands selling through marketplaces where creator links can't always be tracked. Measuring influencer campaign ROI covers attribution methods and how to estimate what tracking misses.
Evaluation checklist
□ Supports our platforms (Instagram, YouTube, others we use)
□ Pulls first-party data from connected creator accounts, and labels estimates
□ Accepts screenshot/manual data for creators who don't connect
□ Stores capture date for every metric
□ Calculates our metrics our way (engagement rate method, CPM on views or reach)
□ Generates or imports per-creator tracking links and codes
□ Connects to our web/store analytics or accepts imports
□ Per-creator and per-campaign views; trend over time
□ Comment and sentiment analysis tested on Hindi and regional content
□ Exports raw data, not only PDFs
□ Access controls for fees and costs
Social analytics and sentiment
Comment and sentiment analysis helps answer whether audiences responded well, not just whether they responded. It's most useful as a summary (common questions, objections, purchase intent) rather than a single positive/negative score. Automated sentiment struggles with sarcasm, emojis and code-mixed Hinglish or regional-language comments, so sample comments yourself before trusting the percentages.
Do you need a dedicated tool?
| Situation | Probably enough |
|---|---|
| Few creators, occasional campaigns | Creator screenshots + UTM links + web/store analytics + a spreadsheet |
| Monthly campaigns, 20+ creators | Influencer software with connected accounts and reporting, or a dashboard on a shared tracker |
| Always-on programme, multiple markets | Influencer analytics connected to web, store and ads data in a dashboard |
Agree metric definitions before you choose a tool
Tools calculate the same metric in different ways. Decide your definitions first, then check each tool can follow them:
| Metric | Decide |
|---|---|
| Engagement rate | Engagements ÷ followers, ÷ reach, or ÷ views? Which actions count? |
| Views | Platform-reported views at a fixed capture day (e.g. 7 days) |
| Reach | Unique accounts reached, from creator insights only |
| Clicks | Sessions in your web analytics from the creator's UTM link, not platform 'taps' |
| Conversions | Delivered orders, qualified leads or installs; state which |
| Cost | Fee plus product, shipping, production, rights and management share |
Instagram now reports views rather than impressions for most content, which changes how CPM and reach comparisons work. Reach vs impressions vs views explains the change.
Attribution for marketplace sellers
Many Indian D2C brands sell through marketplaces as well as their own site. Creator links to a marketplace listing usually can't be tracked with your own analytics in the same way. Practical options include unique discount codes that work on your own site, marketplace-provided attribution or affiliate features where available, sending creator traffic to your own site for the campaign period, and comparing marketplace sales in creator-heavy regions or weeks against a baseline. None is perfect; combining two gives a more defensible estimate.
Example: a reporting setup for a D2C launch
Objective: sales in the first 30 days · 20 micro creators, Instagram
Per creator: UTM link to a launch landing page + unique code
Capture: creator insights at 7 and 30 days (screenshots or connected account)
Web analytics: sessions and conversions by utm_source
Store: orders by code, delivered (not just placed)
Comments: weekly tagging of questions and objections
Dashboard: per-creator cost, views, quality engagements, sessions, delivered orders, CPA
Report at day 35: results vs target, what drove them, what to change
Common mistakes
- Reporting estimated impressions as delivered reach.
- Different capture dates for different creators, making comparisons unfair.
- Engagement rate calculated differently across tools.
- No tracking links or codes, so sales impact can't be estimated at all.
- Buying a tool for its dashboard design rather than its data.
Once the tools are in place, influencer data analytics covers how to turn their output into insights, and influencer sentiment analysis covers reading comments properly.
Conclusion
Choose influencer analytics technology from your KPIs backwards: the data each KPI needs, where that data truly comes from and how to capture it consistently. Prefer creator-provided and tracking data for reporting, keep estimates for scanning, date every number and connect it all in one view. Influencer marketing dashboard covers what that view should contain, and influencer marketing report covers how to present it.