Why Creator Platform Reports and Website Analytics Don't Match, and How to Reconcile Them
Why Instagram, TikTok, Meta Ads and code reports never match Google Analytics: attribution models, lookback windows, view-through credit, broken tracking links and code leakage, plus a step-by-step reconciliation process and the reporting errors to avoid.
A creator campaign ends and three reports arrive: the creator's screenshots, the ads platform's conversions and Google Analytics. None of them match, and someone asks which one is right. Usually all of them are, by their own rules. This guide explains why the numbers differ and how to produce one figure you can defend.
Quick answer
Platforms and website analytics count different things: different attribution models, different time windows, view-through credit versus clicks, and different ways of handling privacy. Before comparing, line up the dates and time zones, use the same definition of a conversion, check that tracking links work, and match everything against your own order or lead records. Report your own records as the main figure and explain the others.
Why the numbers differ
| Cause | What you see | What to do |
|---|---|---|
| Attribution model | GA4 credits a sale to a different channel than the platform does | Note which model each report uses |
| Lookback windows | A platform counts sales days after a click; GA4 uses its own window | Compare like-for-like windows where possible |
| View-through credit | Ads platforms count people who saw an ad and bought later without clicking | Report clicks and views separately |
| In-app browsers, consent and blockers | Clicks in the platform, fewer sessions in GA4 | Expect a gap; watch whether it changes |
| Broken or missing tags | Creator traffic shows as direct or referral | Test every link before it goes live |
| Code leakage | Code sales far above link sales | Check whether codes appeared on coupon sites |
| Dates and time zones | Totals differ at the edges of the campaign | Use one time zone and date range |
| Returns and cancellations | Platform sales higher than finance's numbers | Use net orders for final reporting |
Two examples show how much the settings matter. GA4 uses data-driven attribution or last click, and it retired its first-click, linear, time-decay and position-based models in November 2023. Its default lookback window for most key events is 90 days, adjustable to 30 or 60. On Meta's side, connector documentation from Supermetrics records that the 7-day and 28-day view windows were removed from the Ads Insights API from January 12, 2026, so older reports may not be comparable with newer ones.
A reconciliation process
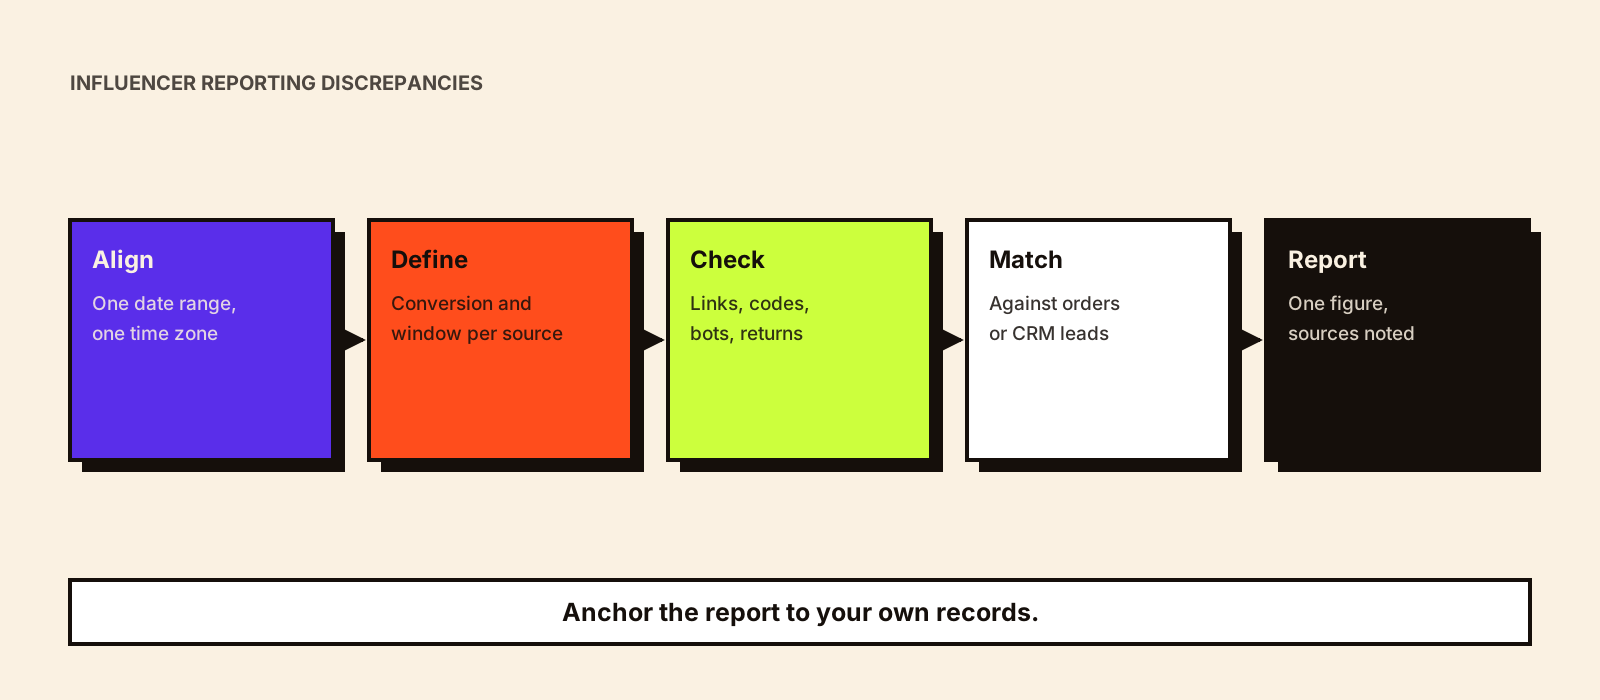
- Agree one date range and time zone for every report
- Write down each source's definition of a conversion and its attribution window
- Pull your own orders or CRM leads for the period, net of returns and cancellations
- Match tagged sessions, code redemptions and platform conversions against those records
- Look for broken links, duplicated codes and bot or test orders
- Report your own records as the main figure, with platform numbers as supporting context
Creator | Posts live (dates) | Link clicks (platform) | Sessions (GA4, tagged) | Orders via link (GA4) | Code redemptions (store) | Platform-reported conversions (window) | Net orders matched to records | Notes (leakage, broken link, timing)
Tracking links that survive
Google's guidance is to always use utm_source, utm_medium and utm_campaign, and utm_content can tell creatives apart. Agree a naming scheme before the campaign, keep values lowercase and consistent so spellings don't split into separate rows, and test each link from a phone inside the app it will be shared in. Link shorteners and link-in-bio tools can strip parameters, so check the final landing URL.
A naming convention that keeps tags consistent is in influencer UTM tracking, and why different attribution models give different totals in influencer marketing attribution models.
Reporting errors to avoid
- Adding platform conversions and GA4 conversions together, counting the same sale twice
- Comparing a 30-day campaign with a 7-day one
- Using creator screenshots as the only source of reach
- Calling engagement rate 'conversion rate'
- Reporting gross sales when returns are high
- Treating code sales as proof the creator caused them, when codes leak
- Leaving out costs such as product, rights and fees
A complete report structure, including how to show uncertainty, is in how to create an influencer marketing report. Where you need to know what creators added beyond tracked sales, see influencer marketing incrementality.
Common mistakes
- Asking which report is 'right' instead of what each one counts
- Fixing tracking after the posts are live
- Not keeping the raw exports behind each number
- Changing definitions halfway through a program
Conclusion
Mismatched numbers are normal. What matters is knowing why they differ, anchoring the report to your own records and being consistent over time. The same discipline makes creator data usable later in a marketing mix model.